


Table of Contents
There are many ways to add a new column to a Pandas DataFrame. I already mentioned a few in the previous articles in this series. Simple derived columns are relatively easy to create because creating them boils down to combining data from already existing columns. However, a topic I still need to go over is how to create complex derived columns.
- Intro to Pandas: What is Pandas in Python?
- Intro to Pandas: How to Add, Rename, and Remove Columns in Pandas
These are usually created not by combining data from other columns, but by either using conditional statements or running a custom function. In this article, I will cover how to create these complex derived columns using the where() method from NumPy and the apply() method from Pandas.
Article continues below
Want to learn more? Check out some of our courses:
How to Create Derived Columns Using the Where() Method
Very often you'll run into a situation where you will want to fill a column with values based on some condition, whether it be simple or complex. Based on what the condition is you'll generally choose whether you are going to use the where() method from NumPy, or the apply() method from Pandas.
The where() method functions very similarly to the Excel IF command and it's typically used when you want to fill a newly created column with values based on a relatively simple condition. To be more precise, what happens in the background is the conditional statement you'll define will create a boolean array that contains True or False values.
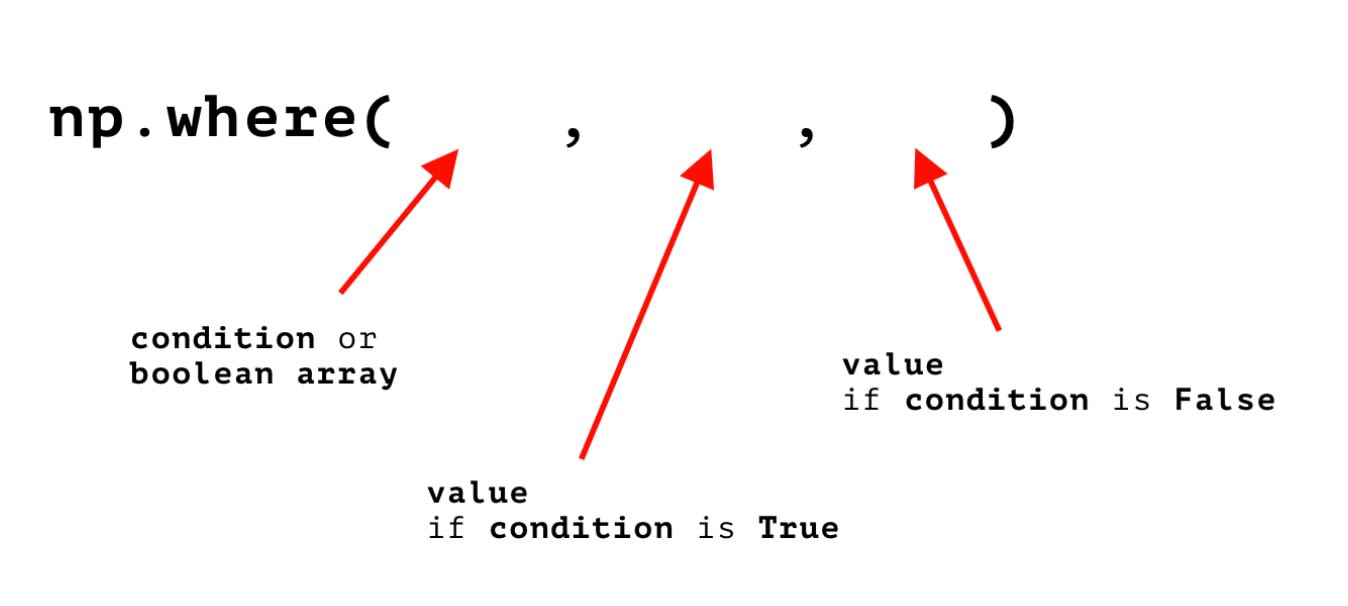
The where() method needs to take in three arguments. The first one is a conditional statement that will create a boolean array. It will then use that boolean array to fill the new column with values. Only two values will appear in the array: True or False. The second argument to the where() method is the value that needs to be inserted if the condition is satisfied (if the value inside the boolean array is True). The third argument is the value that needs to be placed in the new column if the value in the boolean array is False.
In practice this means that you define the where() method in the following way:
Image Source: Edlitera
As you can see in the image above, the where() method is very easy to use. It is preferred over the apply() method not only because of this ease of use, but also because it's a lot more computationally efficient.
Creating a column using the where() method can potentially be a thousand times faster than creating a column using the apply() method, because the where() method leverages the power of vectorization while the apply() method uses loops. Therefore it's recommended to use the where() method over the apply() method whenever possible (but I will cover some specific cases where using the apply() method can't be avoided later in this article).
Let's demonstrate how to use the where() method on an example. First, I will load in some data and create a DataFrame from it using the read_csv() method from Pandas:
# Load in data and create a DataFrame

data = pd.read_csv(
    "https://edlitera-datasets.s3.amazonaws.com/survey_sample.csv",
    parse_dates=['Date']
)
The first five rows of that newly created DataFrame will look like this:
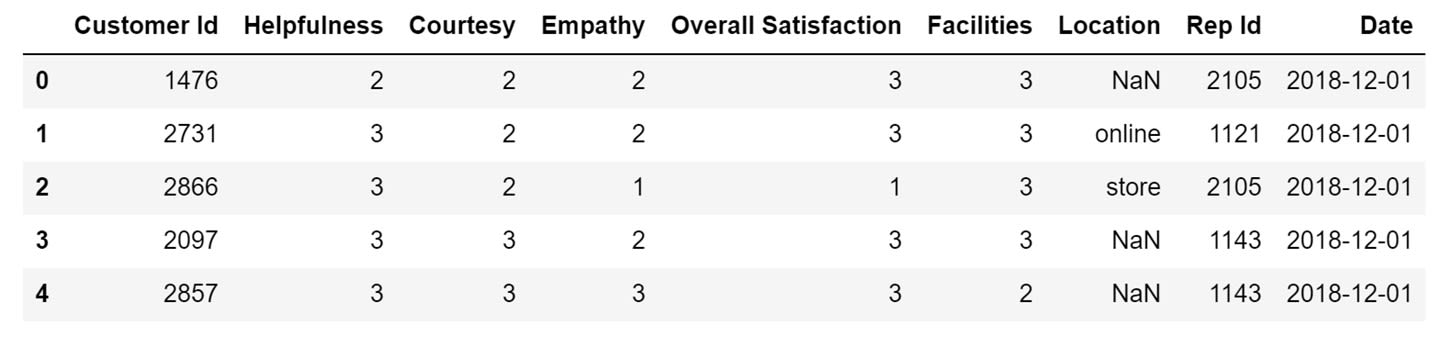
In this DataFrame the Helpfulness column describes how the customers of a clothing store rated the helpfulness of its employees on a scale from 1 to 3. Similarly, the columns Courtesy and Empathy represent how customers rated the employees of that store based on how courteous and how empathic they were.
The overall satisfaction of the customers, defined in the Overall Satisfaction column, is based on the values in these three columns and is also rated on a scale from 1 to 3. This information gives me some pretty good insight into how the customers feel about the service at the store, but the scale from 1 to 3 can be misleading. A person looking at the data for the very first time might not know whether 1 is considered to be the best possible score, or whether 3 is considered to be the best possible score.
To solve this problem let's create a new column called Customer Satisfaction. In this column, I will store the string "good" if the score in the Overall Satisfaction columns is 3, and "bad" if the score in the column is 1 or 2.
The code to create this column using the where() method looks like this:
# Create the new column
# using the where() method

data['Customer Satisfaction'] = np.where(
    data['Overall Satisfaction'] == 3, 'good', 'bad'
)
The first five rows of my DataFrame after I added the new column to it will look like this:
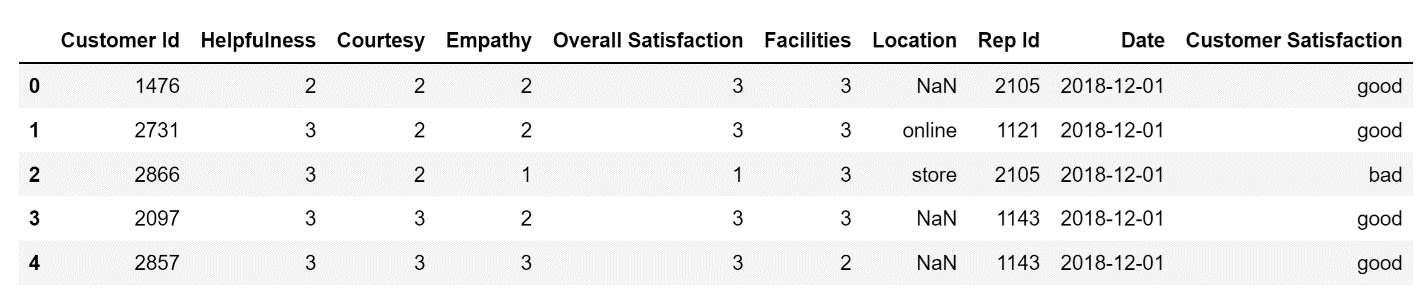
Upon further analysis, it is easy to notice that the values in the Overall Satisfaction column doesn’t make sense.
For example, if I look at the first row, I notice that the Overall Satisfaction is defined as 3, even though the values in the Helpfulness, Courtesy, and Empathy columns are all 2.
Let's create a new column and name it Real Customer Satisfaction. Inside that column, I will store the value 'good' only if the values in the Helpfulness, Courtesy, and Empathy columns are all higher than 2.
The code to create this column using the where() method looks like this:
# Create the new column
# using the where() method

data['Real Customer Satisfaction'] = np.where(
    ((data['Helpfulness'] > 2) &
    (data['Empathy'] > 2) &
    (data['Courtesy'] > 2)),
    'good',
    'bad'
)
The first five rows of my DataFrame after I added the new column to it will look like this:
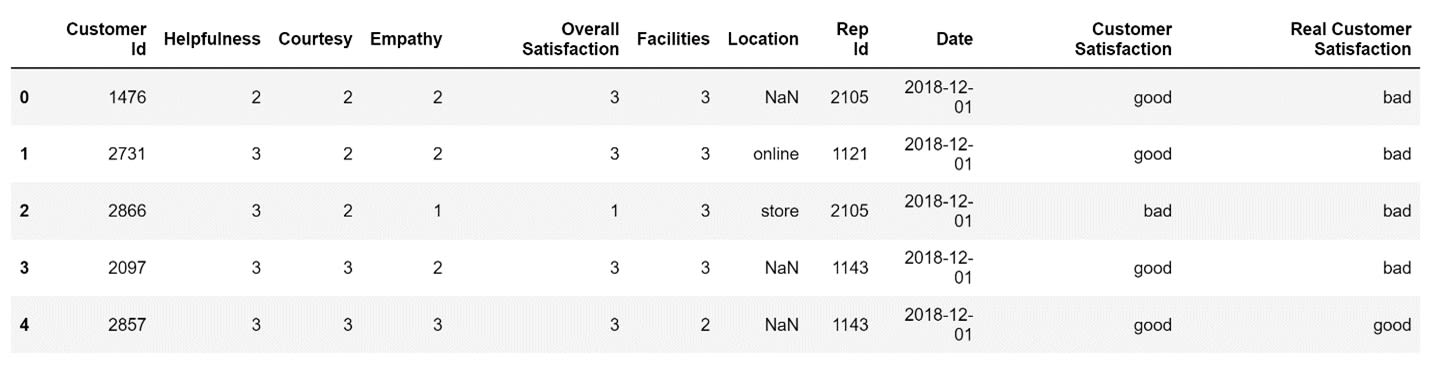
As you can see, a lot of the values in the Overall Satisfaction column don't accurately represent how satisfied a customer that visited the store is with the service provided by the store. That being said, the Real Customer Satisfaction column is a bit too harsh on the store employees. Customers don't need to be perfectly satisfied in all three categories to be happy with how they were treated. Let's use the apply() method to more accurately determine whether a customer was satisfied or not.
How to Create Derived Columns Using the Apply() Method
The apply() method allows you to create derived columns based on, not only conditional statements, but even mathematical calculations. In my example above, I used the where() method to roughly determine how satisfied customers were with the service that was provided to them. However, I can do much better. Instead of relying on a complex conditional statement to try to accurately determine whether a customer was satisfied or not, let's create a custom function and use the apply() method from Pandas to apply that function to each row in our DataFrame.
This is how I will create a new column called Accurate Customer Satisfaction. The function will calculate the average of the values in the Helpfulness, Courtesy, and Empathy columns. If that average is above 2.5, I will store the string ‘good’ in the newly created Accurate Customer Satisfaction column. If the average is not higher than 2.5, I will store "bad."
Let's name that function customer_satisfaction_calculator:
# Create the function that precisely calculates
# whether a customer is overall satisfied or not

def customer_satisfaction_calculator(row):
    mean_satisfaction = (row['Helpfulness'] + row['Empathy'] + row['Courtesy'])/3
    if mean_satisfaction > 2.5:
        return "good"
    return "bad"
Now that my function is ready, I can apply it to each row in our DataFrame using the apply() method to create the new column:
# Create the new column
# using the apply() method

data['Accurate Customer Satisfaction'] = data.apply(customer_satisfaction_calculator, axis=1)
Aside from the function itself, the only other thing I need to define when using the apply() method is a value for the axis argument. This argument is important because it tells Pandas that I want to apply my function to each row in the DataFrame.
The first five rows of my DataFrame after I add a new column to it using the apply() method will look like this:
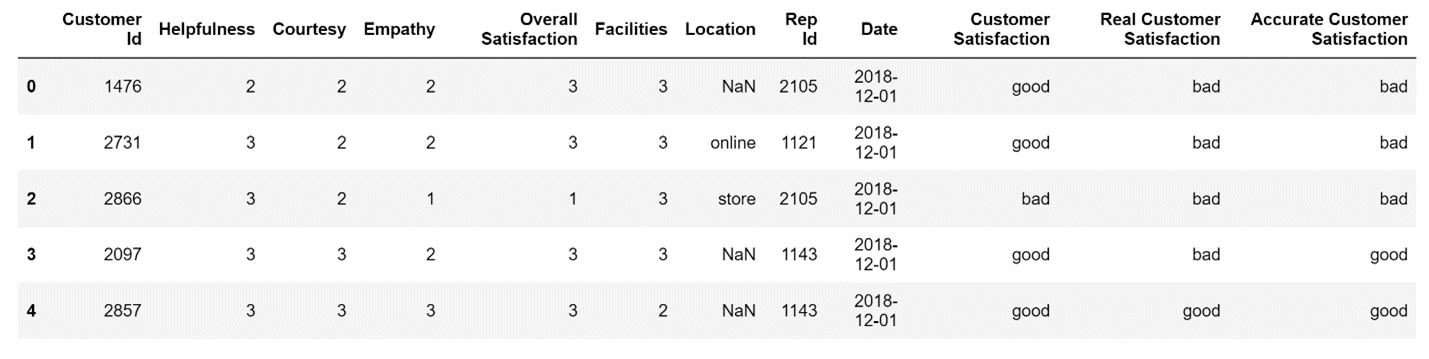
Now, whenever I'm interested in an accurate estimate of the overall satisfaction of a customer, I can just take a look at what the value stored inside the Accurate Customer Satisfaction column is.
While this demonstrates how powerful the apply() method is, it doesn't even scratch the surface of what you can do with it: for example, you can use it to apply a lambda function to each row in your DataFrame so that you don't need to specifically define a function you plan on using only once.
In this article, I covered how to create complex derived columns using the where() and apply() methods. I've also finish this series of articles on the basics of Pandas. Pandas is an extremely powerful library, so covering everything you can do with Pandas is impossible. However, this series of articles on Pandas should prepare you to tackle any problem you run into in general practice.
If you are interested in some specific use cases, such as dealing with time-series data and creating visualizations don't worry: these are the topics I will cover in my next two series of articles on Pandas.

