


Table of Contents
What is data analytics? How about predictive analytics? And how are these two different from data science?
People use different terms to describe the different fields of analytics and data science. Due to the exploding popularity of data science and big data analytics, many of these terms are often used incorrectly and in a confusing fashion.
Around here, I'm all about demystifying confusing stuff, so I aim to set the story straight in this article and offer my own definitions of these terms from the perspective of a hands-on data science practitioner.
What is Data Analytics?
Data analytics is the process of examining a data set to draw conclusions about the information it contains. This process includes systematic computational processing, aggregation, cleaning, reshaping, visualization, and interrogation of data. The output of data analytics is usually a presentation, a report, a dashboard, an application, or even fed directly into an automated workflow.
In some organizations, a centralized business intelligence team is tasked with producing a majority of analyses and reports for all other teams. In other organizations, each team might have at least a dedicated data analyst to crunch the data for their particular area.
Why is Data Analytics Important?
In data-driven companies, data analytics informs decision-making in all functional groups for executives, managers, and front-line workers alike. Companies apply analytics to their data in order to describe, predict, and improve business performance. Good analytics can remove the guesswork from the decision-making process.
Article continues below
Want to learn more? Check out some of our courses:
What Skills Are Needed for Data Analytics?
Working with data requires hard skills in statistics, math, and computer science. As the vast majority of data analysis is done at the request of and for the benefit and consumption of other humans, soft skills like communication, creativity, and teamwork are also important.
Most data analyses these days are done using specialized software. Before the data can be analyzed, it must first be collected, parsed, and stored in some type of database
What is Predictive Analytics?
Predictive analytics is the branch of analytics that aims to use historical data (past data) to make predictions about the future. You can read more about the predictive analytics and machine learning process and their applications in this article.
What is Data Science?
Data science is the process of working with and getting insights from big data. What is big data, you ask? Big data is whatever is too big to analyze in Excel. This includes large volumes of tabular data, unstructured or loosely structured data, images, video, and so on.
At this point, much hype exists around data science, particularly around what is and isn’t “big data,” and around the tools used to extract insights from this data (Python vs. R, TensorFlow vs PyTorch).
However, the “science” part of data science is way more important. You see, data in itself is worth nothing. Even terabytes of data that sit nicely in the most cutting-edge data store system have no value until they are mined for insight, which is then applied to improve business performance. Until the insight-to-business-improvement link is forged, data is actually a cost center, as storage and upkeep have real-world, recurring costs. As such, data science is only useful when data is used to answer questions.
The long-term impact of data science, then, is measured by the quality and number of useful and consequential questions that it can help answer with the data.
“The combination of some data and an aching desire for an answer does NOT ensure that a reasonable answer can be extracted from a given body of data.”
- John Wilder Tukey
Take that from American statistician John Wilder Tukey, who is credited with designing the data sampling techniques that the US Census is still relying on and is widely revered as the father of modern statistics. You could have 100 GB of data, but it might still be the case that only 3 kB of that are actually useful to answer your question. In fact, when setting out to use your data to answer a question, you often discover that you need, in fact, to collect new data.
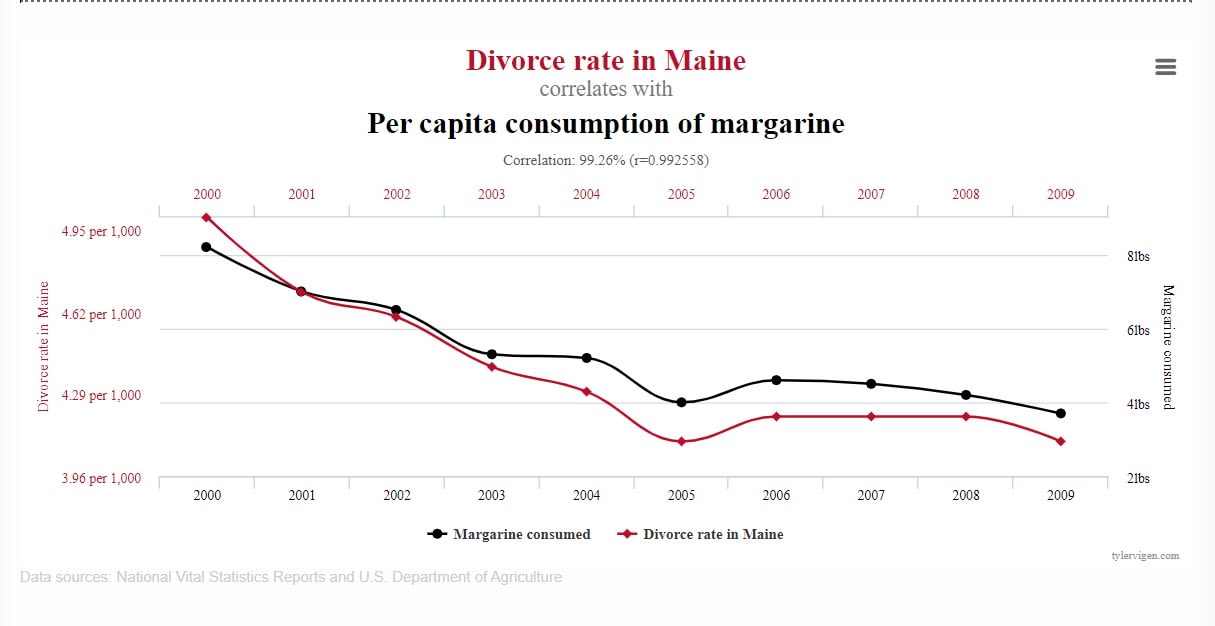
Another frequent point of confusion has to do with correlations in the data. The correlation is a statistic that measures the extent to which two variables move in relation to one another. For example, if one variable is the the divorce rate in Maine and another variable is the per capita consumption of margarine, the correlation between them is the measure of how closely the points align on a straight line when plotted on the same graph like below:
Image source: Spurious Correlations, tylervigen.com
Does the graph show the unintended consequence of divorce rates on margarine consumption or just plain correlation without causation? Correlations in the data are important, but even if you find a thousand correlations in your data, understanding whether they matter to your question is both much harder and much more important. Often, the correlations you find can be due to phenomena completely unrelated to your question, such as measurement error.
What Are Some Engineering Data Science Solutions?
So far, I've established that data science is about:
- Formulating quantitative questions
- Finding data that can be used to answer these questions
- Cleaning this data
- Analyzing it using various techniques like descriptive statistics and/or predictive algorithms
However, the engineering component of data science is often left out of the discussion.
One example of a time when the engineering component was critical was the Netflix Prize. In 2009, Netflix organized an open competition for the best collaborative filtering algorithm to predict user ratings for films based on previous ratings, without any other information about the users or films. The winning team used a lot of machine learning algorithms and built a solution that worked beautifully, of course, in the context of the competition.
However, Netflix ended up not using their method because it was impossible to have it run at scale across all their customer and movie data. In other words, while the winning solution worked for the core problem, it did not work within the engineering constraints of the real world.
Finally, trade-offs always come up in data science. Each data science model has five components: interpretability, simplicity, accuracy, speed, and scalability. As with most things in life, you can’t have it all, something’s gotta give. In the case of the Netflix prize, the winning solution sacrificed speed and scalability. It is up to you to decide which of these five are most important for the problem at hand and which are less of a concern.
What Skills Are Needed for Data Science?
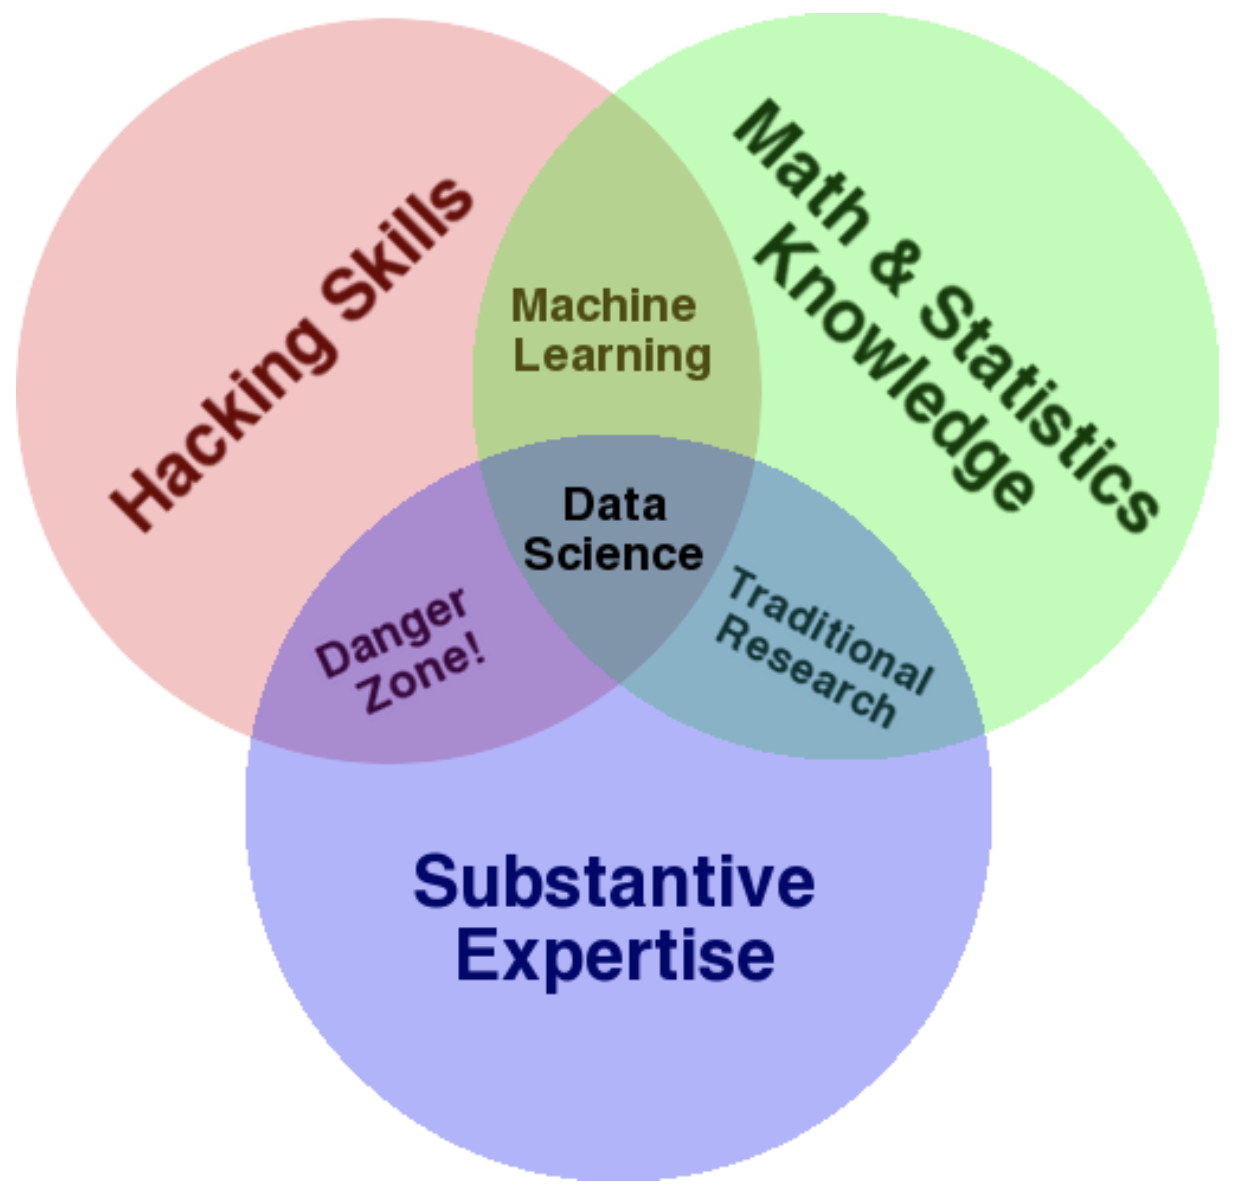
You’ve probably seen this diagram before. I don’t entirely agree with it as there’s nothing particularly dangerous about mixing coding skills with domain expertise, but it is for the most part a good illustration of the different skills needed in the data science process.
Data science skills include:
- Statistics (traditional analysis you’re used to thinking about)
- Data processing (scraping, parsing, and formatting data)
- Visualization (graphs, charts, dashboards, apps)
- Data engineering
- Machine learning
- Domain expertise.
Some have argued that data science is just a rebranding of statistics. Perhaps it would be more accurate to say that data science is statistics done with engineering tools.
Of course, not all data science roles require all of the skills above in equal proportions. Some need more of some and less of others. Even if they did, almost no one has equal experience in all of these things. This is why data science at scale is a team sport.
What Are Statistics Good For?
Statistics is the discipline of analyzing data. It is the basis of data science, machine learning, and traditional statistical analysis. The following are the key activities that define statistics:
- Descriptive statistics: This includes exploratory data analysis, which is the necessary starting step of the data science process, unsupervised machine learning, clustering, and basic data summaries. Descriptive statistics help us get familiar with our data and to arrive at the hypothesis which will be tested later in the process.
- Inference: This is the process of drawing conclusions about a population from a sample. The inference process needs a defined hypothesis in order to generalize what we learn from a sample to the entire population.
- Prediction: This is the process of trying to guess an outcome given a set of realizations of the outcome (i.e. a training data set) and some predictors.
- Experimental design: This is the act of controlling your experimental process in order to optimize the chance of arriving at a strong conclusion. One example of an important factor in experimental design is randomization. In randomization, a treatment is applied at random across experimental units in order to make the treatment and control groups as comparable as possible. For instance, in a critical trial, patients are randomly assigned to receive a new drug, a placebo, or nothing. Randomization is critical in clinical trials and in A/B testing.
That was the difference between data analytics, predictive analytics, and data science, as well as the role that statistics plays in it all. If you found this useful, make sure to subscribe to our highly infrequent newsletter to learn about future hot-off-the-press guides and blogs like this one.

