

Table of Contents
- How to Import Required Packages in Python Pandas
- How to Create a Series From a Python Pandas List
- How to Create an Empty DataFrame With Specific Columns in Python Pandas
- Create a DataFrame From Series Objects in Python Pandas
- How to Create a DataFrame From a Python Pandas Dictionary
- How to Create a DataFrame With a Custom Index in Python Pandas
- How to Read Data Into a DataFrame in Python Pandas
- From a CSV File:
- Specify Which Columns to Import From a CSV File:
- Automatically Parse Dates From a CSV File:
- Read a CSV File with No Header:
- Read From a Pipe-Delimited File:
- Read From an Excel File From a Specific Sheet:
- Read From a Fixed-Width File:
- Read From a JSON File:
- Read From a Parquet File:
- Read From a Database:
- How to Export Data in Python Pandas
- How to Add or Remove Data From a DataFrame in Python Pandas
- Add a Column:
- Remove Columns:
- Remove Columns (In Place):
- Append a Row to a DataFrame
- Append the Rows of One DataFrame to the Rows of Another DataFrame:
- Append the Rows of One DataFrame to the Rows of Another DataFrame (Alternative Way):
- Append the Columns of One DataFrames to the Columns of Another DataFrame:
- Remove Rows Using Row Index Labels (In Place):
- Remove Rows That Meet a Certain Condition (In Place):
- How to Merge Data in Python Pandas
- How to Select Data Using Integer Positions in Python Pandas
- Select the First Row and Return a Series:
- Select the Ninth Row and Return a Series:
- Select the Second, Third, and Fourth Rows:
- Select the Last 2 Rows:
- Select the First, Fourth and Fifth Rows:
- Select the First Column and Return a Series:
- Select the First Column and Return a One-Column DataFrame:
- Select the Last Column and Return a Series:
- Select All Columns Except for the First and Last:
- Select the First, Third and Fourth Columns:
- Select the Last Two Columns of the Second and Third Rows:
- Select the First and Last Columns of the First and Last Rows:
- Select Every Other Column of the First and Last Rows:
- How to Select Data Using Labels (Column Names and Row Index Labels)
- Select a Column Using the Column Name and Return a Series:
- Select a Column Using the Column Name and Return a One-Column DataFrame:
- Select Multiple Columns Using Column Names:
- Select the Row(s) With the Row Index Label "a":
- Select the Row(s) With the Row Index Label 0:
- Select the Row(s) Which Have the Specified Datetime Object as the Row Index Label:
- Select all the Rows Located Between the Row With Label 'a' and the Row With Label 'u':
- Select the Rows With Labels 'a', 'u', or 'd':
- Select the Rows With Labels 1, 5, 6:
- Select the Column Named 'Country' and Return a Series:
- Select the Column Named 'Country' and Return a Single Column DataFrame:
- Select the Columns Named 'Country' and 'Surface':
- Select the Rows and Columns With the Specified Labels:
- How to Select Data Using Lists of Boolean Values
- How to Select Data Randomly in Python Pandas
- How to Aggregate and Summarize Data in Python Pandas
- How to Apply Custom Data Transformations
- How to Filter Data in Python Pandas
- How to Sort Data in Python Pandas
- How to Rename Column/Row Index Labels
- How to Describe Data in Python Pandas
- Display the First Five Columns of a DataFrame:
- Display the Last Five Columns of a DataFrame:
- Display the Column Index:
- Display the Row Index:
- Display the Shape of the Data (Number of Rows/Columns):
- Display Basic Information About the Data:
- Display Basic Descriptive Statistics:
- Return the Mean of Each Column as a Series:
- Return the Median of Each Column as a Series:
- Return the Standard Deviation of Each Column as a Series:
- Return the Highest Value From Each Column:
- Return the Lowest Value From Each Column:
- Return the Pearson Correlation Between Columns:
- How to Handle Missing Data in Python Pandas
- How to Use Data types in Python Pandas
How to Import Required Packages in Python Pandas
import pandas as pd
import numpy as np
How to Create a Series From a Python Pandas List
With Default Index:
numbers = pd.Series([10, 20, 30, 40, 50])
With Custom Index Values:
numbers = pd.Series(
    [10, 20, 30, 40, 50],
    index = [1, 2, 3, 4, 5])
How to Create an Empty DataFrame With Specific Columns in Python Pandas
df = pd.DataFrame(columns=["first_column", "second_column"])Create a DataFrame From Series Objects in Python Pandas
odds = pd.Series([1, 3, 5, 7, 9])
evens = pd.Series([2, 4, 6, 8, 10])

df = pd.DataFrame({"Odd numbers": odds, "Even numbers": evens})
How to Create a DataFrame From a Python Pandas Dictionary
df = pd.DataFrame({
    'Letter': ['c', 'e', 'z', 'o'],
    'Anima': ['cat', 'elephant', 'zebra', 'orangutan']})
How to Create a DataFrame With a Custom Index in Python Pandas
df = pd.DataFrame({
    "A" : [1, 2, 3],
    "B" : [4, 5, 6],
    "C" : [7, 8, 9]},
    index = ['u', 's', 't'])
How to Read Data Into a DataFrame in Python Pandas
From a CSV File:
csv_data = pd.read_csv("input.csv")
Specify Which Columns to Import From a CSV File:
csv_data = pd.read_csv("input.csv", usecols=['col1', 'col4', 'col5'])
Automatically Parse Dates From a CSV File:
csv_data = pd.read_csv("input.csv", parse_dates=['Start Date', 'End Date'])
Read a CSV File with No Header:
Below, you're reading a CSV file with two columns named colA and colB.
csv_data = pd.read_csv("input.csv", header=None, names=['colA', 'colB'])
Read From a Pipe-Delimited File:
pipe_delimited_data = pd.read_csv("input.csv", sep='|')
Read From an Excel File From a Specific Sheet:
excel_data = pd.read_excel("input.xlsx", sheet_name="Sheet3")
Read From a Fixed-Width File:
fwf_data = pd.read_fwf("input.txt")
Read From a JSON File:
json_data = pd.read_json("input.json")
Read From a Parquet File:
parquet_data = pd.read_parquet("input.parquet.gzip", engine="pyarrow")
Read From a Database:
You will need the sqlalchemy and psycopg2 Python packages:
pip install sqlalchemy
pip install psycopg2
And then:
from sqlalchemy import create_engine

conn = create_engine('postgresql://user:pwd@db-name.endpoint.us-east-1.rds.amazonaws.com:5432/postgres')
sql_data = pd.read_sql_query("SELECT * FROM my_table", conn)
WARNING: do not store credentials in code!
How to Export Data in Python Pandas
Export CSV Files:
data.to_csv('output.csv')
Export CSV Files Without the Index:
data.to_csv('output.csv', index=False)
Export Pipe-Delimited Files:
data.to_csv('output.csv', sep='|')Export Excel Files:
You may need openpyxl and xlsxwriter:
pip install openpyxl
pip install xlsxwriter
And then:
data.to_excel('output.xlsx', engine='xlsxwriter')
Export Excel Files With a Specific Sheet Name:
data.to_excel('output.xlsx', engine='xlsxwriter', sheet_name='Sheet2')
Export Parquet Files:
data.to_parquet("output.parquet.gzip", compression="gzip")
Export Databases or Data Warehouses:
Suggested method:
- Output to CSV or Parquet files in your data lake (e.g., AWS S3 buckets)
- Bulk import using copy ... from ... or equivalent methods (e.g., AWS Redshift can import data directly from AWS S3)
How to Add or Remove Data From a DataFrame in Python Pandas
Add a Column:
df["new_column_name"] = "default_value"
Remove Columns:
df.drop(columns=["column_1", "column_2"])Remove Columns (In Place):
df.drop(columns=["column_1", "column_2"], inplace=True)
Append a Row to a DataFrame
df1.append({'colA': 'some_value', 'colB': 'another_value'}, ignore_index=True)
Append the Rows of One DataFrame to the Rows of Another DataFrame:
df1.append(df2, ignore_index=True)
Append the Rows of One DataFrame to the Rows of Another DataFrame (Alternative Way):
pd.concat([df1, df2])
Append the Columns of One DataFrames to the Columns of Another DataFrame:
pd.concat([df1, df2], axis=1)
Remove Rows Using Row Index Labels (In Place):
df.drop(index=['a', 'b', 'z'], inplace=True)
Remove Rows That Meet a Certain Condition (In Place):
The code below removes (in place) all the rows where the Customer Id value is 0:
indices_to_drop = df[ df['Customer Id'] == 0 ].index
df.drop(indices_to_drop, inplace=True)
How to Merge Data in Python Pandas
Left Merge (Similar to a SQL Left Join):
pd.merge(df1, df2,
    left_on="df1_column", right_on="df2_column",
    how="left")
Article continues below
Want to learn more? Check out some of our courses:
Right Merge (Similar to SQL Right Join):
pd.merge(df1, df2,
    left_on="df1_column", right_on="df2_column",
    how="right")
Inner Merge (Similar to SQL Inner Join):
pd.merge(df1, df2,
    left_on="df1_column", right_on="df2_column",
    how="inner")
Outer Merge (Similar to SQL Full Join):
pd.merge(df1, df2,
    left_on="df1_column", right_on="df2_column",
    how="outer")
Merging On Index:
pd.merge(df1, df2,
    left_index=True, right_index=True,
    how="outer")
NOTE: when merging on index, you can do a left, right, inner or outer merge as well.
How to Select Data Using Integer Positions in Python Pandas
The integers below refer to the row and column position (first, second, etc.). They do not represent column names or row index labels. Also note that iloc uses square brackets [ ], not parentheses ( ).
Select the First Row and Return a Series:
df.iloc[0]
Select the Ninth Row and Return a Series:
df.iloc[8]
Select the Second, Third, and Fourth Rows:
df.iloc[1:4]
Select the Last 2 Rows:
df.iloc[-2:]
Select the First, Fourth and Fifth Rows:
df.iloc[[0, 3, 4]]
Select the First Column and Return a Series:
df.iloc[:, 0]
Select the First Column and Return a One-Column DataFrame:
df.iloc[:, [0]]
Select the Last Column and Return a Series:
df.iloc[:, -1]
Select All Columns Except for the First and Last:
df.iloc[:, 1:-1]
Select the First, Third and Fourth Columns:
df.iloc[:, [0, 2, 3]]
Select the Last Two Columns of the Second and Third Rows:
df.iloc[[1, 2], -2:]
Select the First and Last Columns of the First and Last Rows:
df.iloc[[0, -1], [0, -1]]
Select Every Other Column of the First and Last Rows:
df.iloc[[0, -1], ::2]
How to Select Data Using Labels (Column Names and Row Index Labels)
Any integers below refer to actual row index labels, in a hypothetical scenario where those row index labels are integers. They do not refer to actual row or column positions.
Select a Column Using the Column Name and Return a Series:
df["column_name"]
Select a Column Using the Column Name and Return a One-Column DataFrame:
df[["column_name"]]
Select Multiple Columns Using Column Names:
df[["column_1", "column_2"]]
Select the Row(s) With the Row Index Label "a":
This will raise an error if no rows have the specified index label.
df.loc["a"]
Select the Row(s) With the Row Index Label 0:
This is not the same as selecting the first row. There may be one or more rows with the row index label 0. This will raise an error if no rows have the specified label.
df.loc[0]
Select the Row(s) Which Have the Specified Datetime Object as the Row Index Label:
df.loc[datetime.datetime(2030, 12, 31)]
Select all the Rows Located Between the Row With Label 'a' and the Row With Label 'u':
This includes the rows with labels 'a' or 'u'. It may include no rows, one row, or more rows.
df.loc['a':'u']
Select the Rows With Labels 'a', 'u', or 'd':
This will return a DataFrame with more than 3 rows if several rows have labels 'a', 'u,' or 'd'.
df.loc[ ['a', 'u', 'd'] ]
Select the Rows With Labels 1, 5, 6:
This will return a DataFrame with more than 3 rows if several rows have labels 1, 5, or 6.
df.loc[ [1, 5, 6] ]
Select the Column Named 'Country' and Return a Series:
df.loc[:, 'Country']
Select the Column Named 'Country' and Return a Single Column DataFrame:
df.loc[:. ['Country']]
Select the Columns Named 'Country' and 'Surface':
df.loc[:, ['Country', 'Surface']]
Select the Rows and Columns With the Specified Labels:
df.loc[ ["row_label_1", "row_label_22"], ["column_name_1", "column_name_2 "] ]
How to Select Data Using Lists of Boolean Values
Select Specific Rows and Columns Using Lists of Boolean Values:
The first list must have as many boolean values as there are rows. The second list must have as many booleans as there are columns. Only rows and columns corresponding to True values will be returned:
df.iloc[ [True, True, False, False, False], [True, True, False, False] ]or
df.loc[ [True, True, False, False, False], [True, True, False, False] ]
Select Specific Rows and Columns Using Combinations of Integer Positions and Lists of Booleans:
The code below returns the first two columns of the second, third, fourth, fifth, sixth, and seventh rows in the DataFrame.
df.iloc[1:7, [True, True, False, False]]
Select Specific Rows and Columns Using Combinations of Row Index Labels and Lists of Booleans:
The code below returns the first two columns of all the rows in the DataFrame located between the row with label 1 and the row with label 7, including.
df.loc[1:7, [True, True, False, False]]
How to Select Data Randomly in Python Pandas
Randomly Select 'n=50' Rows
df.sample(n=50)
Randomly Select a Fraction of Rows
df.sample(frac=0.5)How to Aggregate and Summarize Data in Python Pandas
How to Summarize Data Using a Pivot Table:
Below
- index will determine the row MultiIndex
- columns will determine the column MultiIndex
- values are the values to aggregate
- aggfunc will determine the aggregation functions to apply to each of the value columns
data.pivot_table(
    index=['RepName', 'Location'],
    columns=['Year', 'Month'],
    values=['Helpfulness', 'Courtesy', 'Empathy'],
    aggfunc=['mean', 'std']
)
How to Summarize Data Using a Pivot Table and Include Totals:
data.pivot_table(
    index=['RepName', 'Location'],
    columns=['Year', 'Month'],
    values=['Helpfulness', 'Courtesy', 'Empathy'],
    aggfunc=['mean', 'std'],
    margins=True
)
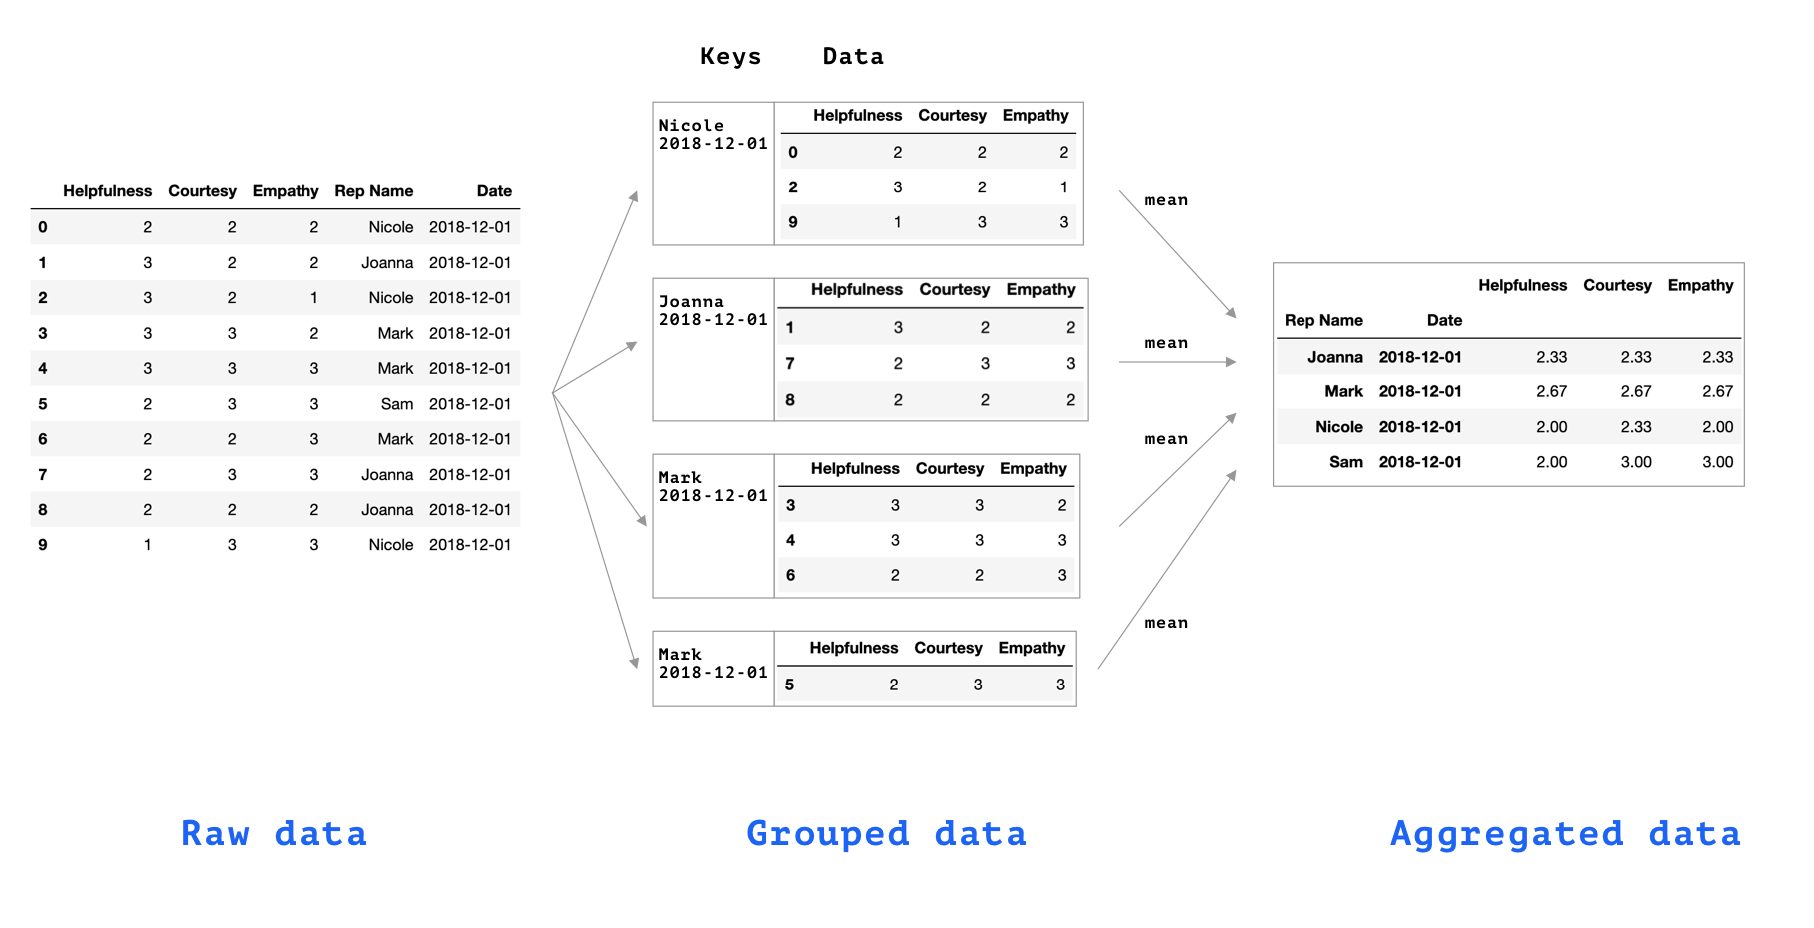
How to Summarize data Using 'groupby':
data[ ['Helpfulness',
      'Courtesy',
      'Empathy',
      'RepName',
      'Date'] ].groupby( ['RepName', 'Date'] ).mean()
How to Compute Multiple Aggregations Using 'groupby':
data[ ['Helpfulness',
      'Courtesy',
      'Empathy',
      'RepName',
      'Date'] ].groupby( ['RepName', 'Date'] ).agg( ['mean', 'std'] )
'groupby' Syntax Explained:
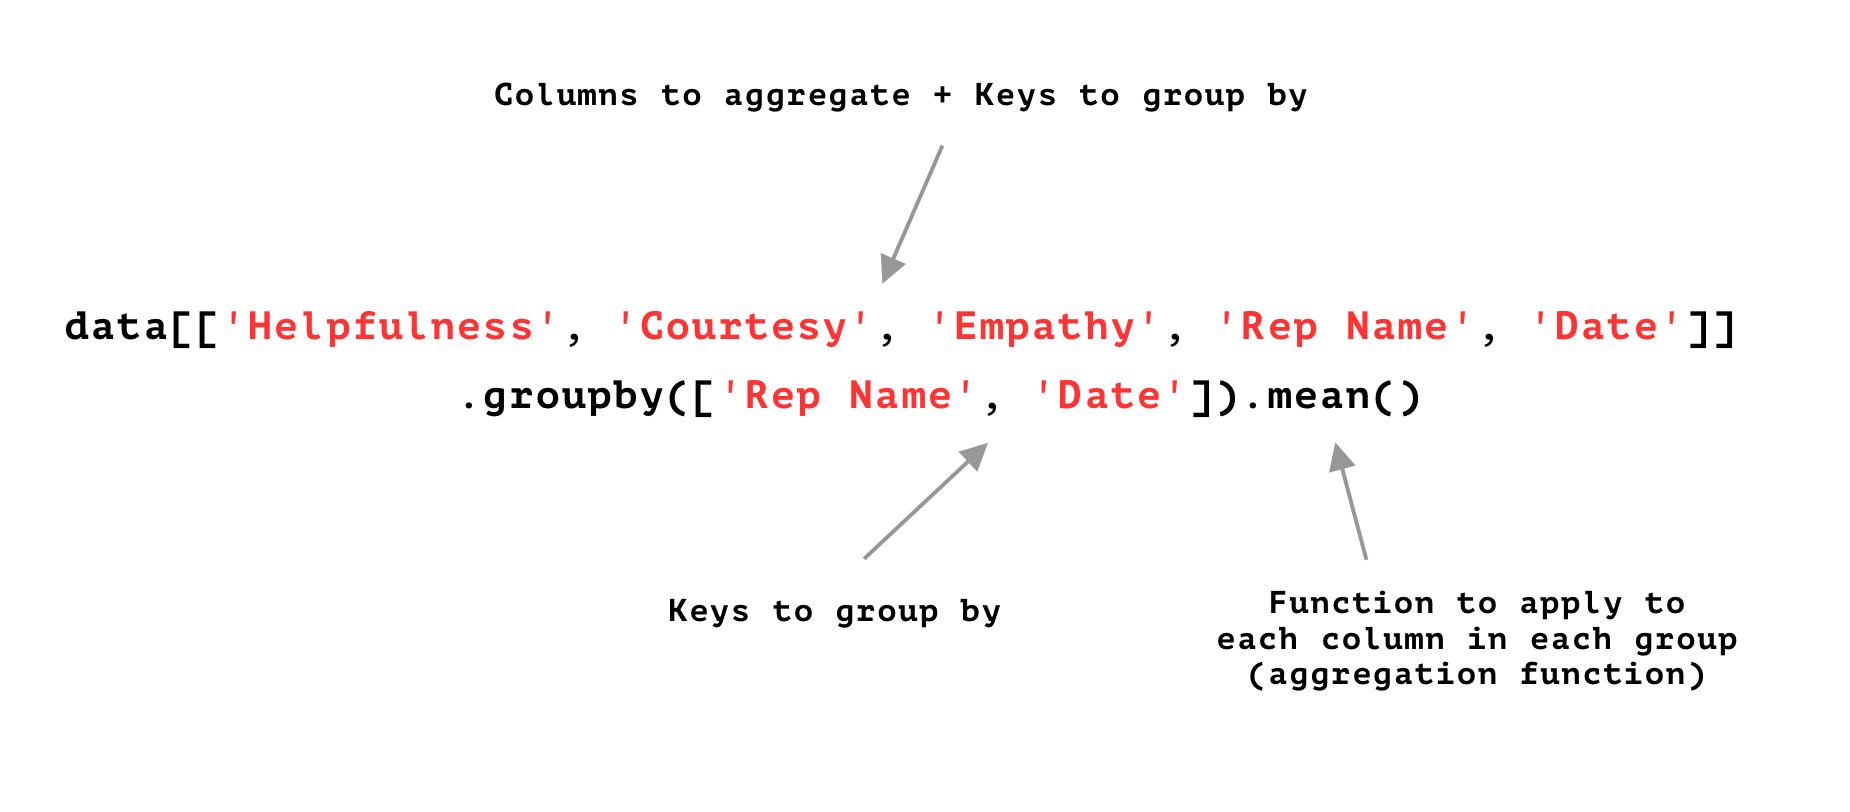
'groupby' Mechanics Explained:
How to Apply Custom Data Transformations
Create a Derived Column From Existing Columns:
df['new_column'] = (df['col_A'] * 3 + df['col_B']) / df['col_C']
Create a Derived Column Using String Transformations of Existing Columns:
df['uppercase_names'] = df['names'].str.upper()
df['lowercase_names'] = df['names'].str.lower()
df['name_initial'] = df['names'].str[0]
Create a Derived Column Using a Custom Function:
def low_score(row):
    if (row['Helpfulness'] < 2 and
        row['Empathy'] < 2 and
        row['Courtesy'] < 2):
        return 1
    return 0

data['Low Score'] = data.apply(low_score, axis=1)
Update Columns Which Meet a Condition With a Specified Value:
The code below updates all the missing values in the column Location to be N/A:
data.loc[ data['Location'].isnull(), ['Location'] ] = 'N/A'The code below updates all the values in the column Amount that are less than 100 to be 150:
data.loc[ data['Amount'] < 100, ['Amount'] ] = 150How to Filter Data in Python Pandas
Select Rows Based On Simple Condition and Include All Columns:
df[ df['customer_id'] == 1121 ]
Select Rows Based On More Complex Condition and Include All Columns:
Use & for logical 'and,' | for logical 'or,' and ~ for 'negations.'
df[ (df['customer_id'] > 1121) & (df['customer_id'] < 2232) ]
Combine Indexing and Filtering:
The code below will return the values in columns Letter and Animal of all the rows where the first character in the Animal column is greater than 'd' (i.e. 'e,' 'f,' 'g,' ...):
df.loc[ df['Animal'].str[0] > 'd', ['Letter', 'Animal'] ]The code below will extract the data in the columns whose names have more than 6 characters:
df.loc[:, df.columns.str.len() > 6]How to Sort Data in Python Pandas
Sort Data in Ascending Order:
df.sort_values(by=['col1', 'col2'])
Sort Data in Ascending Order (In Place):
df.sort_values(by=['col1', 'col2'], inplace=True)
Sort Data in Descending Order:
df.sort_values(by=["col_A"], ascending=False)
Sort the Index of a DataFrame:
df.sort_index()
Sort the Index of a DataFrame (In Place):
df.sort_index(inplace=True)
Reset the Index of a DataFrame:
df.reset_index()How to Rename Column/Row Index Labels
Rename Columns:
df.rename(columns={"old_column_1": "new_column_1", "old_column_2": "new_column_2"})
Rename Columns in Place:
df.rename(columns={"old_column_1": "new_column_1", "old_column_2": "new_column_2"},
    inplace=True)
Rename Row Index Labels:
In the code below, rows index label 0 is replaced with 1 and row index label 1 is replaced with 2.
df.rename(index={0: 1, 1: 2})
How to Describe Data in Python Pandas
Display the First Five Columns of a DataFrame:
df.head()Display the Last Five Columns of a DataFrame:
df.tail()
Display the Column Index:
The code below will print an object containing the column names. It can be iterated over.
df.columns
Display the Row Index:
df.index
Display the Shape of the Data (Number of Rows/Columns):
df.shape
Display Basic Information About the Data:
df.info()
Display Basic Descriptive Statistics:
df.describe()
Return the Mean of Each Column as a Series:
df.mean()
Return the Median of Each Column as a Series:
df.median()
Return the Standard Deviation of Each Column as a Series:
df.std()
Return the Highest Value From Each Column:
df.max()
Return the Lowest Value From Each Column:
df.min()
Return the Pearson Correlation Between Columns:
df.corr(method='pearson')
How to Handle Missing Data in Python Pandas
How to Check for Missing Data:
df.isnull().any()
How to Return the Number of Non-Null Values in Each Column:
df.count()
How to Remove Rows With Missing Data:
df.dropna()
How to Remove Columns With Missing Data:
df.dropna(axis=1)
How to Replace Missing Values With a Default Value (e.g., 0) in Place:
data['Amount'].fillna(0, inplace=True)
How to Use Data types in Python Pandas
Display the Data Type of Each Column:
df.dtypes
Change the Data Type of a Column:
data['Country'] = data['Country'].astype('category')Note: replace data_type with data types such as str, int, float, etc.

