


Table of Contents
- What is a Pandas DataFrame?
- How to Create a Pandas DataFrame
- How to Create an Empty Pandas DataFrame
- How to Create a Pandas DataFrame From a List
- How to Create a Pandas DataFrame From an Array
- How to Create a Pandas DataFrame from Pandas Series Objects
- How to Create a Pandas DataFrame by Importing Data from Files
- How to Create a Pandas DataFrame From a CSV File
- How to Create a Pandas DataFrame From an Excel File
<< Read previous in series: Intro to Pandas: What Are Pandas Series Objects?
In this article, I will cover the fundamentals of Pandas DataFrames and I will also go over how you can create them, both manually and from other files. Pandas DataFrames are often treated as the basic building block of the Pandas package, even though they are essentially collections of Pandas Series objects. This article will only serve as a short introduction to Pandas DataFrames because I won't focus on processing data that is stored inside DataFrames, but will instead leave that for subsequent articles in this series.
- Intro to Pandas: What is Pandas in Python?
- Intro to Programming: Why Beginners Should Start With Python
- Intro to Programming: What Are Packages in Python?
Once you understand how to build a Pandas DataFrame, learning how to manipulate data that is stored inside of them becomes relatively easy with the many in-built Pandas functions that boil down performing complex operations to simple one-liners.
What is a Pandas DataFrame?
Pandas DataFrames are two-dimensional data structures in which you can store tabular data. DataFrames are actually very similar to Excel sheets in that sense. So if you think about a Pandas DataFrame like an Excel sheet, you must also define what is a column in a Pandas DataFrame. That is a Pandas Series object. While it's typically thought that the basic building blocks of Pandas is a Pandas DataFrame, since those DataFrames consist of one or more Pandas Series objects, it is more accurate to say that the basic building block of Pandas is a Pandas Series.
But, in practice, you will mostly see Pandas DataFrame objects referred as fundamental Pandas objects. There are multiple reasons for that.
First, a Pandas DataFrame allow you to represent multidimensional data. In practice, you will rarely work with one-dimensional data, and you will mostly work with tables of data. You can't represent a table of data with a Pandas Series object, so you will instead use a Pandas DataFrame object to do so.
Second, because Pandas is built on top of NumPy amongst other libraries, performing operations on columns of a Pandas DataFrame is extremely efficient and fast. In most cases, the difference between using a Pandas DataFrame and a NumPy array is, for all practical purposes, negligible. Especially when you take into consideration the third factor.
The third, and final reason, is the plethora of in-built functionality that is supported by Pandas DataFrames. Aside from presenting data in a visually attractive way, that helps you better understand what exactly are you working with, you can also use a lot of highly advanced functions that allow you to perform complex operations with simple one-liners.
For example, to get a full statistical analysis of a Pandas DataFrame you just need to use one method on your DataFrame and you will find out the minimum value, maximum value, mean, median, etc., for each particular column in your Pandas DataFrame.
How to Create a Pandas DataFrame
There are many ways to create a Pandas DataFrame. You can even create an empty Pandas DataFrame, if you want. Depending on how your data is structured you can create a new Pandas DataFrame from a:
- List
- Array
- Dictionaries
- Pandas Series Objects
- CSV files
- Excel Files
- Databases
- Fixed-width files
- Text files
This is a partial list of the many different data structures you can create in a Pandas DataFrame. It is impossible to name all of them because Pandas has many different data loading methods that can work on various types of data, as long as you structure them properly.
In practice, you will usually create Pandas DataFrames by importing data stored in various files of different formats. That is a topic that I will cover a bit later. So, for now, let's demonstrate some of the ways you can manually create a Pandas DataFrame.
To preface the following few subchapters of the article, I must mention that manually creating Pandas DataFrames is not something that you will do very often, but it is still useful to know when you do run into one of those rare cases where you can't straight up create a DataFrame by importing data from some other file.
Article continues below
Want to learn more? Check out some of our courses:
How to Create an Empty Pandas DataFrame
Sometimes you might run into a situation where you know how you want your data to be structured inside a Pandas DataFrame, but you don't have the data you want to store in the DataFrame at your disposal yet. In such cases, you can create an empty Pandas DataFrame that you can later fill with values.
To manually create a DataFrame in Pandas you'll use the DataFrame constructor. There are multiple values that you can input into the DataFrame constructor, as you will see later on. The only value that you'll need to input when creating an empty Pandas DataFrame is how you will want your columns to be named. Then you can fill those columns with data later on if you want.
For example, let's create an empty DataFrame with two columns, Letter and Country, and store it inside the country_df variable. To do that, after importing pandas under the pseudonym pd, you will use the following code:
country_df = pd.DataFrame( columns=["Letter", "Country"] )This will create a DataFrame that looks like this:
Image Source: Screenshot of empty Pandas DataFrame columns, Edlitera
How to Create a Pandas DataFrame From a List
It is very uncommon to run into a situation where you'll need to create a Pandas DataFrame from a single list. A single list represents one-dimensional data, so it is better to store that data inside a Pandas Series object. It is much more common to create a Pandas DataFrame from a list of lists, because that is multidimensional data and is exactly what you'll want to store inside Pandas DataFrames.
However, to be thorough, let's demonstrate both techniques.
If you want to create a Pandas DataFrame with one column from a list that contains some data, you need to input that data into the DataFrame constructor, followed by how you want to name the column that will store that data.
If you don't assign a name for the column that you create, Pandas will automatically name that column. It will give the first unnamed column the name 0, the second one the name 1, etc.
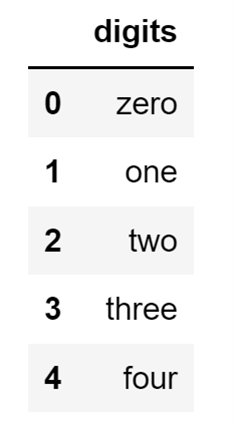
Let's create a Pandas DataFrame with one column. I will name that column digits, and I'll store a list of digit names inside:
data = pd.DataFrame(
["zero", "one", "two", "three", "four"], columns=["digits"])
The DataFrame I get by running this code will look like this:
Image Source: Screenshot of a one-column Pandas DataFrame, Edlitera
This one-column DataFrame looks very similar to how a Series object would look if I were to create it from a list of values. Like how you can define an index when working with a Series constructor, you can also define your index when working with a DataFrame constructor.
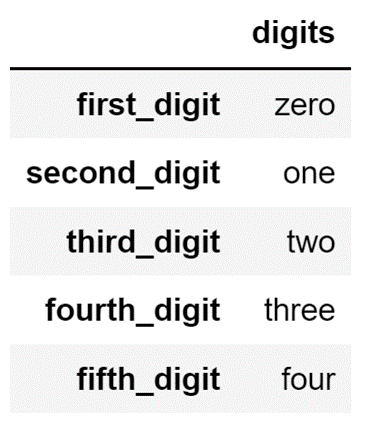
Let's change the index of my one-column DataFrame:
list_of_digits = ["zero", "one", "two", "three", "four"]
index_names=[
	"first_digit",
      "second_digit",
	"third_digit",
	"fourth_digit",
	"fifth_digit"]

data = pd.DataFrame(list_of_digits, columns=["digits"], index= index_names)
The code above will create the following DataFrame:
Image Source: A screenshot of defined indices in a one-column Pandas DataFrame, Edlitera
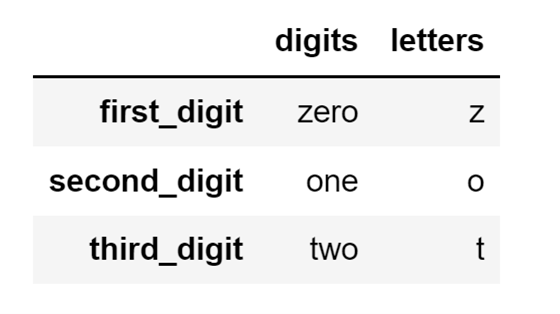
I can also, as mentioned previously, create a DataFrame that contains multiple columns from a list of lists. Let's create one by nesting another list into my main list. This second list will contain the first character of every digit name and will be called letters:
first_nested = ["zero", "z"]
second_nested = ["one", "o"]
third_nested = ["two", "t"]

data = [first_nested, second_nested, third_nested]

index_names=[
    "first_digit",
    "second_digit",
    "third_digit"]

df = pd.DataFrame(data, columns=["digits", "letters"], index= index_names)
The code above will create a DataFrame that looks like this:
Image Source: A screenshot of a nested-list two-column Pandas DataFrame, Edlitera
How to Create a Pandas DataFrame From an Array
Among manual creation procedures creating DataFrames from arrays is much more common than creating DataFrames from lists, mainly because Pandas is built on top of NumPy. This means that you can easily convert any NumPy array into a Pandas DataFrame.
To do that, you'll need to input the array into your DataFrame constructor as the data that you'll want to store in your DataFrame, and you just need to define the names of your columns.
Let's take a look at an example.
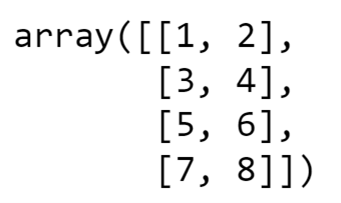
Let's say that I’m working with the following NumPy array stored in the variable arr:
Image Source: Screenshot of a NumPy array, Edlitera
The array above can easily be converted into a Pandas DataFrame with two columns by running the following code:
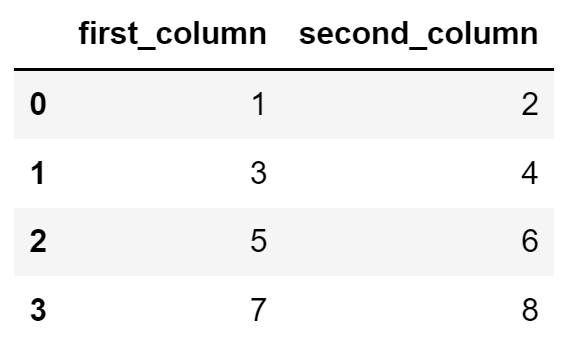
df = pd.DataFrame(arr, columns=["first_column", "second_column"])The code above will create a Pandas DataFrame that will look like this:
Image Source: A screenshot of a Pandas two-column DataFrame from a NumPy array, Edlitera
As you can see, creating a Pandas DataFrame from an array is much simpler than creating one from a list of lists.
How to Create a Pandas DataFrame from Pandas Series Objects
DataFrame columns are nothing more than Series objects. So the easiest way of manually creating a Pandas DataFrame is to combine multiple Pandas Series objects into one.
Let's demonstrate with an example:
First, I'll create two Pandas Series using the Series constructor.
alphabet = pd.Series(
    ["c", "d", "z", "o"],
    index=[2, 3, 4, 5])

animals = pd.Series(
    ["cat", "dolphin", "zebra", "orangutan"],
    index=[2, 3, 4, 5])
Now, let's combine these two Pandas Series objects into a Pandas DataFrame object. To do that, I will input a dictionary into the Pandas DataFrame constructor. The keys of the dictionary will be column names, and the values will be our two Series objects:
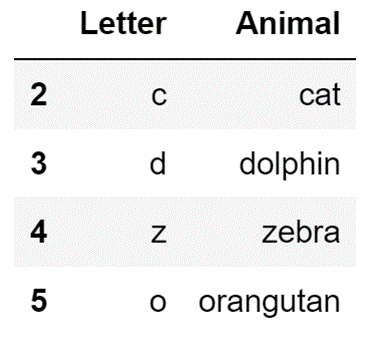
animals_data = pd.DataFrame( {'Letter': alphabet, 'Animal': animals} )Running the code above, after creating the two Series objects, will create a Pandas DataFrame that will look like this:
Image Source: A screenshot of a two-column Pandas DataFrame from a dictionary, Edlitera
How to Create a Pandas DataFrame by Importing Data from Files
There are multiple data formats that you can import data directly from and Pandas will properly format into a Pandas DataFrame object.
The most common ones are:
- CSV files
- Excel files
Pandas also make it easy to read data from databases such as:
- AWS Redshift
- PostgreSQL
- AWS Aurora
- Microsoft SQL Server
- Oracle
- Etc.
The functions that allow you to import data from files of other formats are typically called read functions:
- read_excel - imports data Excel files (you can even specify which sheet)
- read_fwf - imports data fixed-width files
- read_json - imports data from JSON files
- read_parquet - imports data from Parquet files (column-based files often used in data lakes)
- read_sql - reads data from a SQL database
For now, I will demonstrate how to import data from a CSV file and an Excel file. I will leave explaining how to import data from databases for when I talk about dealing with large amounts of data in Pandas, because that topic is more relevant in that context.
How to Create a Pandas DataFrame From a CSV File
To create a Pandas DataFrame from a CSV file, you use the read_csv() function. To load in data using it, you need to supply the DataFrame with a few values.
First off, you'll need to supply the DataFrame with a path to your file. It can be a standard file path (e.g., a path to the file on your computer), but it can also be a link that leads to the CSV file (e.g., a link that leads to the file stored in an AWS S3 bucket).
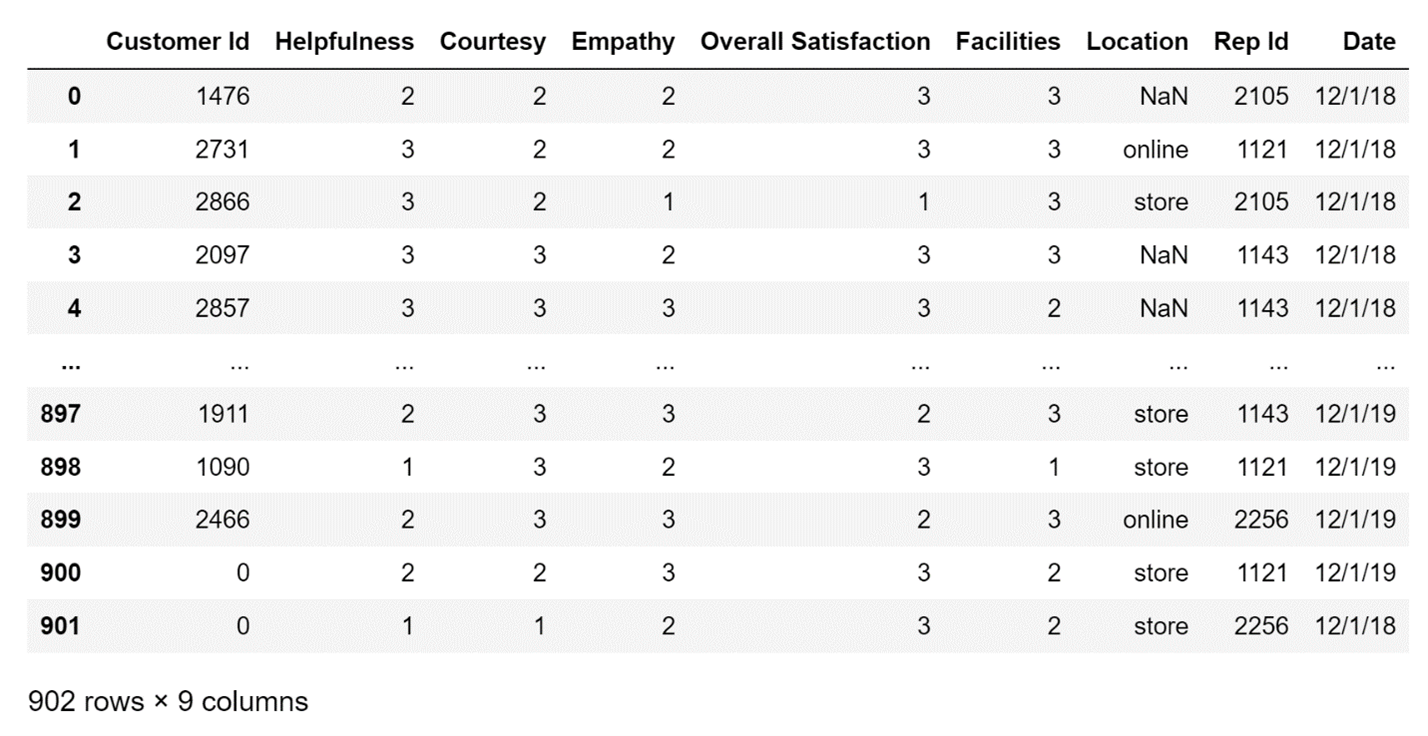
To demonstrate, let's use the function to load some data from an S3 bucket, and store it in the df variable:
df=pd.read_csv(
"https://edlitera-datasets.s3.amazonaws.com/survey_sample.csv"
)
The code above will create the following DataFrame:
Image Source: A screenshot of data from an S3 Bucket loaded into a DataFrame, Edlitera
You can do much more than what has been demonstrated above. For example, you can create a DataFrame from a select few columns of the original CSV files, ignoring the others.
To do that, you'll need to define a value for the usecols parameter of the function; you just input a list of the columns that you'll want to use.
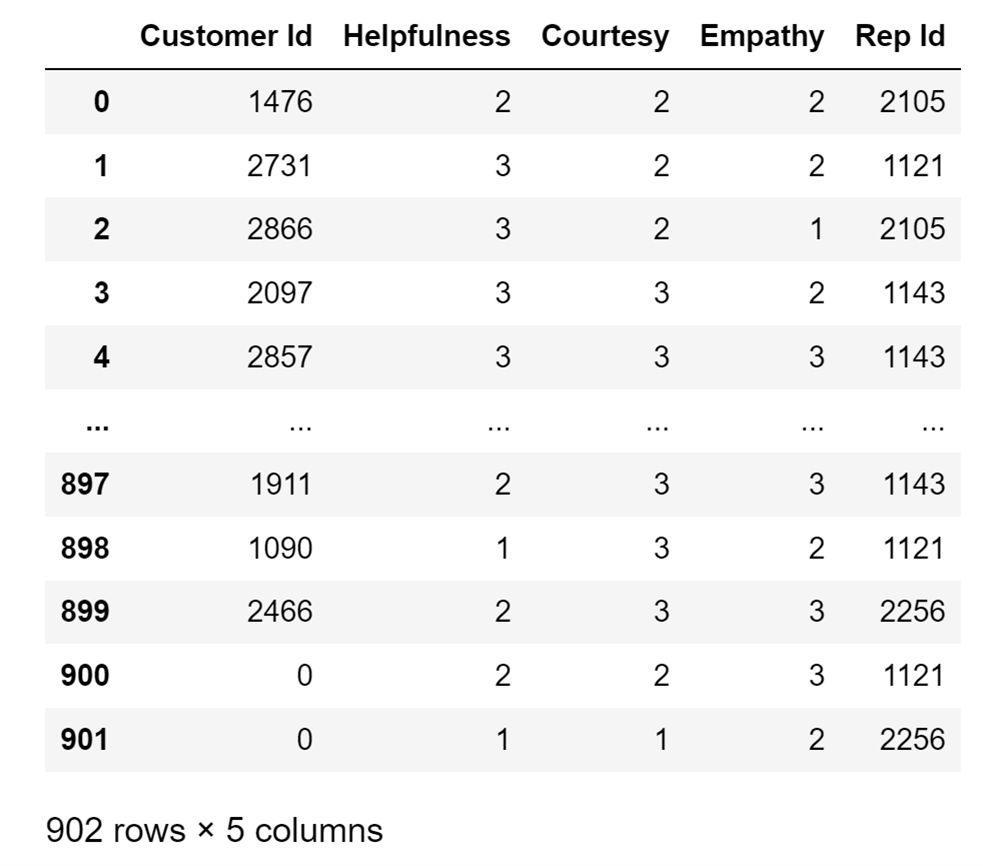
Let's demonstrate how to do it on the same CSV file that I used a few moments ago:
df = pd.read_csv(
    "https://edlitera-datasets.s3.amazonaws.com/survey_sample.csv",
    usecols=["Customer Id", "Helpfulness", "Courtesy", "Empathy", "Rep Id"]
)
By running the code above, I will get a DataFrame that looks like this:
Image Source: A screenshot of selected data columns from the Usecols Parameter of a file, Edlitera
As you can see, only the columns I specified are included in this version of the DataFrame.
There are other optional arguments you can define when importing data from a CSV file that allow you to customize the DataFrame that you will get.
For example, if your CSV file uses a special delimiter, you can define what the delimiter is by inputting a value in the read_csv() function under the delimiter parameter. There are a plethora of options, which you can find by analyzing the documentation of the read_csv() function.
One of the more important ones is parsing time series data, but I am going to leave that for another article in this series where I'll cover how to use time-series data in Pandas.
How to Create a Pandas DataFrame From an Excel File
To load in data from an Excel file, you will use the read_excel() function from Pandas. This function allows you to read data stored in Excel files. It is very precise. You can not only read all of the data that is stored in the Excel file, but also just specific sheets.
In practice, if you try to load in all of the sheets, they won't be stored in a Pandas DataFrame, but will instead be converted into a dictionary. It is common practice to import data from one sheet at a time.
To import data you need to first specify a path to it (the same way I did for the read_csv() function), and then you need to specify which sheet you want to import.
When specifying which sheet to import you have three options:
- Not enter any value aside from the path to the file – this will import the first sheet of the Excel file by default.
- Enter the path to the file and the name of the sheet you want to import – this will import the specific Excel sheet from the Excel file.
- Enter the path to the file and enter None as the name of the sheet you want to import - this will import all sheets as a dictionary.
Because it is the most common way the function is used, I'll demonstrate how to import a specific sheet from an Excel file.
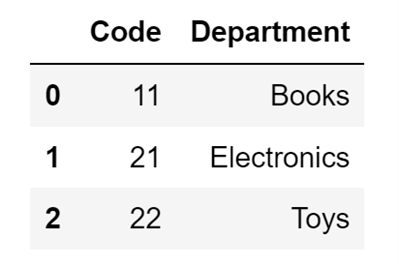
I will import the Departments sheet from an Excel file stored in an S3 bucket and store the created DataFrame in the departments variable:
departments = pd.read_excel(
    "https://edlitera-datasets.s3.amazonaws.com/survey_mappings.xlsx",
    sheet_name="Departments")
The code above will create the following DataFrame:
Image Source: A screenshot of importing a specific sheet from an Excel file into a DataFrame, Edlitera
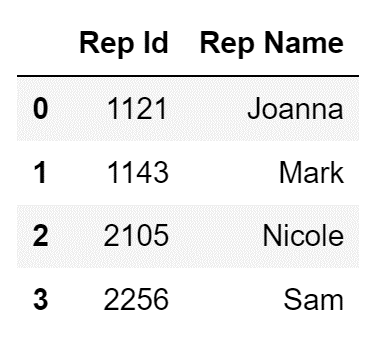
To demonstrate further, I can go ahead and import data from another sheet of the same Excel file:
reps= pd.read_excel(
    "https://edlitera-datasets.s3.amazonaws.com/survey_mappings.xlsx",
    sheet_name=" Reps")
The code above will create the following DataFrame:
Image Source: A screenshot of importing data sheet from the same Excel file shown in the previous example into a DataFrame, Edlitera
In this article, I covered what is a Pandas DataFrame and how you create one. I demonstrated both how to manually create one, and how to create one by importing data from another file. While manual creation won't often come into play, it is important to know how DataFrames are created manually, because it serves as a great introduction to the topics that I will cover later in this series of articles that focus on how to manipulate data stored in Pandas DataFrame objects.
As for importing data, it is the fundamental way of actually creating DataFrames, and is what you will do in practice. It also makes it easy to transition from using other tools (e.g., Excel itself), because you can import data from the same formats that are used by other tools.
The focus of this article was on importing data from CSV files and Excel files since those are the ones you will use most often, but I will cover how to import other types of files in the subsequent articles when I start covering topics that are closely related to using them.

