


Table of Contents
In their 2013 “DataMatics” survey, McKinsey Global Institute found that data-driven organizations are twenty-three times more likely to acquire customers, seven times more likely to retain those customers, and nineteen times more likely to be profitable. However, other surveys show that the primary obstacle to the adoption of analytics in organizations is the lack of understanding of how to use analytics to improve business. In fact, few of the organizations that do become data-driven manage to get the most value out of their data. As a result, they also miss the opportunity to become top performers.
Building a data-driven organization is not a one-step solution, and requires more than just data and technology. It also requires a solid organizational foundation and an understanding of data-driven culture.
This article discusses how to build a data-driven organization by highlighting what is— and what is not—part of a data-driven culture. In this article, I’ll discuss culture in relation to analytics maturity, data literacy, and data leadership.
What is Data-Driven Culture?
The challenges to creating a data-driven organization are not only technical, but are issues of mindset. Making data-driven decisions seem normal and automatic to your employees is difficult, which is why you should first build the pillars of a data-driven culture. The culture of your organization influences who has access to data, what data can be shared, and how much investment is made into people and tools.
A data-driven culture typically has three characteristics. First, a data-driven organization has data-centric foundations. These foundations include the ability to access and share data, as well as the ability to train employees to harvest the data.
Second, a data-driven culture is a goals-first culture. This means that experimental design, metrics, and success criteria are clear to everyone. By sharing clear goals, the interpretation and analysis of data science results can be openly discussed.
Third, a data-driven culture is an anti-HiPPO culture, which I’ll talk more about later. An anti-HiPPO organization has leadership that is committed to advancing through the stages of analytics maturity.
What is Analytics Maturity?
In theory, there are eight levels of analytics. The progression from one level to the next is known as “analytics maturity.” However, analytics doesn’t always follow a straight-forward path. In fact, it often cuts across levels within an analysis. Let’s take a look at each of the eight levels of analytics:
- Standard Reports: these answer the questions, such as what happened and when did it happen? Examples of standard reports are monthly or quarterly financial reports, as well as some business intelligence reports.
- Ad Hoc Reports: these answer the questions how many, how often, and where? An example of an ad hoc report is a hospital report that describes the number of hospital patients per diagnosis for each day of the week.
- Query Drill Down: otherwise known as online analytical processing, or OLAP. Query drill down reports answers the questions where exactly is the problem and how do I find the answers? An example of query drill down is the data discovery of the types of cell phone users and their behavior when making calls.
- Alerts: these answer the questions when should you react and what actions are needed now? CPU utilization is an example of a common alert.
- Statistical Analysis: this answers the questions why is this happening and what opportunities am I missing? For example, a statistical analysis could be used to explain why more customers of a certain bank are refinancing their homes at one point in time compared to other times.
- Forecasting: this answers the questions what if these trends continue, how much is needed, and when will it be needed? Forecasting is used when retailers predict the demand for products from store-to-store.
- Predictive Modeling: this answers the questions what will happen next and how will it affect your business? For instance, predictive modeling is used when casinos predict which VIP customers will be more interested in certain vacation packages.
- Optimization: this answers the questions how do you do things better and what is the best decision for a complex problem? Optimization can be used when trying to select the best IT infrastructure for multiple conflicting business and resource constraints.
In a 2010 study called “Analytics: The New Path to Value,” MIT Sloan Management Review collaborated with IBM Institute for Business Value and found that, when compared to low performers, top performers were five times more likely to use analytics. If you aspire to get to the top, remember the importance of analytics maturity!
How to Create a Successful Data-Driven Culture
In this section, I’ll discuss seven characteristics of organizations that have successfully implemented a data-driven culture.
Article continues below
Want to learn more? Check out some of our courses:
1. Trust Culture
If you want to create a data-driven culture, it also means creating an open and trusting culture in your organization around your data. Data-driven organizations provide broad access to data not only to the core analytics team, but also to other teams, individuals, and business units. Although data sources are typically managed by multiple teams, a data-driven organization understands that the data is not “owned” by the teams. Rather, the data belongs to the whole organization.
Some companies struggle to build a data-driven culture due to concerns regarding privacy and security related to data sharing. These concerns show a lack of trust in employees within the organization. To avoid this, make sure you’re proactive in preventing data hoarding within your teams.
2. Data Literacy Culture
To be successful in promoting a data-driven culture in your organization, you’ll also need to make sure that a fact-based perspective is ingrained at a larger scale. Companies like Bloomberg, Adobe, and Guardian Insurance organized so-called “digital academies” in order to promote data literacy among their employees.
Not just your individual contributors, but also managers and other decision makers should be data-literate. Why? A few reasons.
First, managers are responsible for signing the checks to purchase, install, and maintain a new arsenal of artificial intelligence (AI) tools, services, and initiatives. This means that managers must fully understand and support the advantages that data-literacy will bring to the organization. Second, managers will be the ones who suffer from reduced productivity while team members are learning new tools and skills. Managers need to believe in the longer-term gains to get through the learning curve period. And third, managers make the final decisions based on the analyses. To do so, they must know how to recognize flaws in the results of a data analysis and speak up if they’re presented with a poor analysis.
3. Goals-First Culture
A data-driven culture also means a goals-first culture. A goals-first culture is one in which everyone knows the aims of your organization and share in the same vision. The leadership of an organization is responsible for aligning people with that vision. It is also essential that each member of a team has an understanding of how their work contributes to reaching the ultimate goals of the organization.
Unfortunately, many workers are not aware of how their daily duties help their companies. A Robert Half Management Resources survey found that only 47% of workers feel they understand how their individual contributions affect their companies’ bottom lines. Facilitate your team's involvement in setting their own goals, and provide more feedback to keep everyone motivated to achieve them.
4. Objective Culture
Data-driven organizations encourage an unbiased culture. This includes an atmosphere of healthy debate where anyone is welcome to ask for clarifications and extra information. For instance, scientists are trained to be objective and depersonalize their work. To consider your organization data-driven, you need to promote this same objective outlook.
Here’s an example of objectivity: during a website A/B test, you find out that a larger checkout button does not lead to a higher revenue than a smaller button would. Although you personally prefer the larger button, in an objective work culture you shouldn’t let your personal opinions get in the way of deciding between the smaller and bigger button.
Unfortunately, in the AI world, there are much more serious instances of non-objective culture causing problems than the A/B test example. For instance, Joy Buolamwini has made it her job to fight bias in algorithms. In her work, she’s brought to light many problems with the use of facial recognition for people of color due to unfair sampling. Joy’s work illuminates the presence of human bias that can operate behind machines. While humans will always be part of the design process, you must still try to be as objective as possible in AI design.
5. Learning Culture
Let’s imagine you’re a data scientist working for an e-commerce website. Items on this website are limited and only sold for three days, or until the site runs out. Your job is to build models that predict how many units of each product will be sold by the end of one day and by the end of three days. Unfortunately, once the model is ready, you realize that there are plenty of prediction errors and you now have to spend time digging into and investigating those errors.
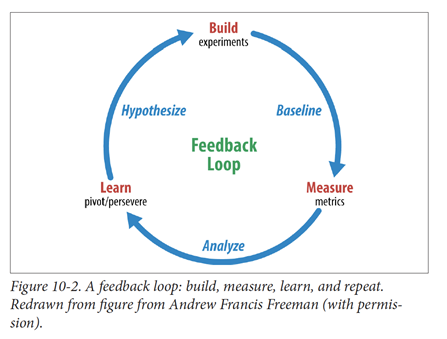
A learning culture makes the important learning process described above possible. Instead of stressing about the prediction errors, you, as a data scientist coming from a learning culture, follow a productive set of next steps. After you designed and built an experiment, you measured your results, interpreted them, learned something new, and then, based on what you learned, built a new experiment. In other words, you’re turning a mistake into a learning opportunity! You can see this process play out in the feedback loop pictured below.
Source: Anderson, Creating a Data-Driven Organization: Practical Advice from the Trenches O’Reilly Media, Inc., 2015
6. Anti-HiPPO Culture
The famous Milgram experiment in 1963 concluded that humans have an authority bias. In other words, the experiment concluded that humans are very likely to listen to the opinion of an expert and do as they dictate. Today, we call this the “HiPPO” effect. HiPPO, or Highest Paid Person’s Opinion, is a term coined by Avinash Kaushik in his book Web Analytics: An Hour a Day.
I’ve already highlighted that a data-driven culture is an anti-HiPPO culture. In fact, a HiPPO culture is the very opposite of a data-driven culture. HiPPOs make gut-based decisions without taking into consideration all available data. Data-driven culture makes decisions based on data.
However, sometimes you may not have all the data available to you, especially if you’re working in new territory. Other times, while your data may be informative, decisions can still be followed by uncertainty. This is okay, and does not automatically put you and your organization in HiPPO territory.
7. Data Leadership-Culture
Data leadership is vital in the creation of a successful data-driven culture. Data-driven organizations need leadership that inspires and promotes a data-driven culture. A genuine data leader has three key ambitions:
First, they help the analytics organization by providing them with the data, tools, and training that they need. Second, a data leader will seek buy-in from their organization, especially the business leaders. A good data leader understands the need to show results, even if they’re small, to rapidly foster a data sharing and trust culture. Third, a data leader must gain support from the senior management team.
Remember that you’re not alone in your journey to a data-driven culture. Every business that is now data-driven has found success with the right leadership and by gaining analytics maturity. Find your success by creating a trusting culture, promoting data literacy, and being inquisitive and open to learning throughout this challenge. So, one question remains: Are you ready to grow your data culture?

