


Table of Contents
It is undeniable that Excel is the most commonly used tool in data analysis. Its simplicity combined with how powerful it is when mastered makes it the top choice for many people. However, when compared with Pandas, it quickly becomes obvious just how limited Excel really is. It simply can't stand shoulder to shoulder with Pandas in terms of what it offers. So the real question is why do more people use Excel than Pandas?
The answer to that question is very simple. Most people are not familiar with Python and find the idea of learning any programming language scary. Also, humans are creatures of habit. Once you get into a routine, you tend to stay in it. For most data analysts, that routine is using Excel. Switching over to Pandas and learning some Python seems so problematic and time-consuming that most people would rather stay in their comfort zone than take the time to learn something completely new, and potentially hard.
But the truth is, learning Pandas is not hard, even for people that are unfamiliar with programming. A big misconception is that one needs to be an expert programmer to use a tool like Pandas. In reality, it requires just some basic Python knowledge. Of course, you could choose to keep learning after mastering the basics, but stopping when you learn just enough Python to use Pandas effectively isn't against any rules. Writing code is not exclusively reserved for programmers, and knowing a little bit of coding goes a long way.
All of this assumes that Pandas is a tool good enough to warrant spending some extra time to learn. Most people that switch to Pandas become so accustomed to its speed that they forget how much longer it took them to finish the same task using Excel. This becomes especially obvious once you consider the amount of automation that can be achieved using Python and Pandas.
What Are the Advantages of Pandas Over Excel?
The advantages of Pandas over Excel are just products of how Pandas works. Because it is built on NumPy (Numerical Python), Pandas boasts several advantages over Excel:
- Scalability - Pandas is only limited by hardware and can manipulate larger quantities of data.
- Speed - Pandas is much faster than Excel, which is especially noticeable when working with larger quantities of data.
- Automation - A lot of the tasks that can be achieved with Pandas are extremely easy to automate, reducing the amount of tedious and repetitive tasks that need to be performed daily.
- Interpretability - It is very easy to interpret what happens when each task is run, and it is relatively easy to find and fix errors.
- Advanced Functions - Performing advanced statistical analysis and creating complex visualizations is very straightforward.
These are not the only advantages of Pandas over Excel. One of the biggest advantages comes from Python itself. Pandas is built to perfectly integrate with machine learning modules in Python. This brings about so many benefits that it would require an article of its own to properly explore. For the sake of brevity, let's just say that learning Pandas leaves data analysts only a step away from transitioning to machine learning engineers.
What Are the Differences Between Pandas and Excel?
Let's compare how a few common tasks are done in Excel, along with their counterparts in Pandas, to debunk the myth that Pandas is extremely hard and takes a lot of time to learn. I will use the IMDB-Movie-data dataset to demonstrate the following tasks:
- Looking at and representing data
- Selecting data
- Sorting data
- Filtering data
- Subtracting data
- Merging datasets
- Pivoting data
Looking At and Representing Data
Excel
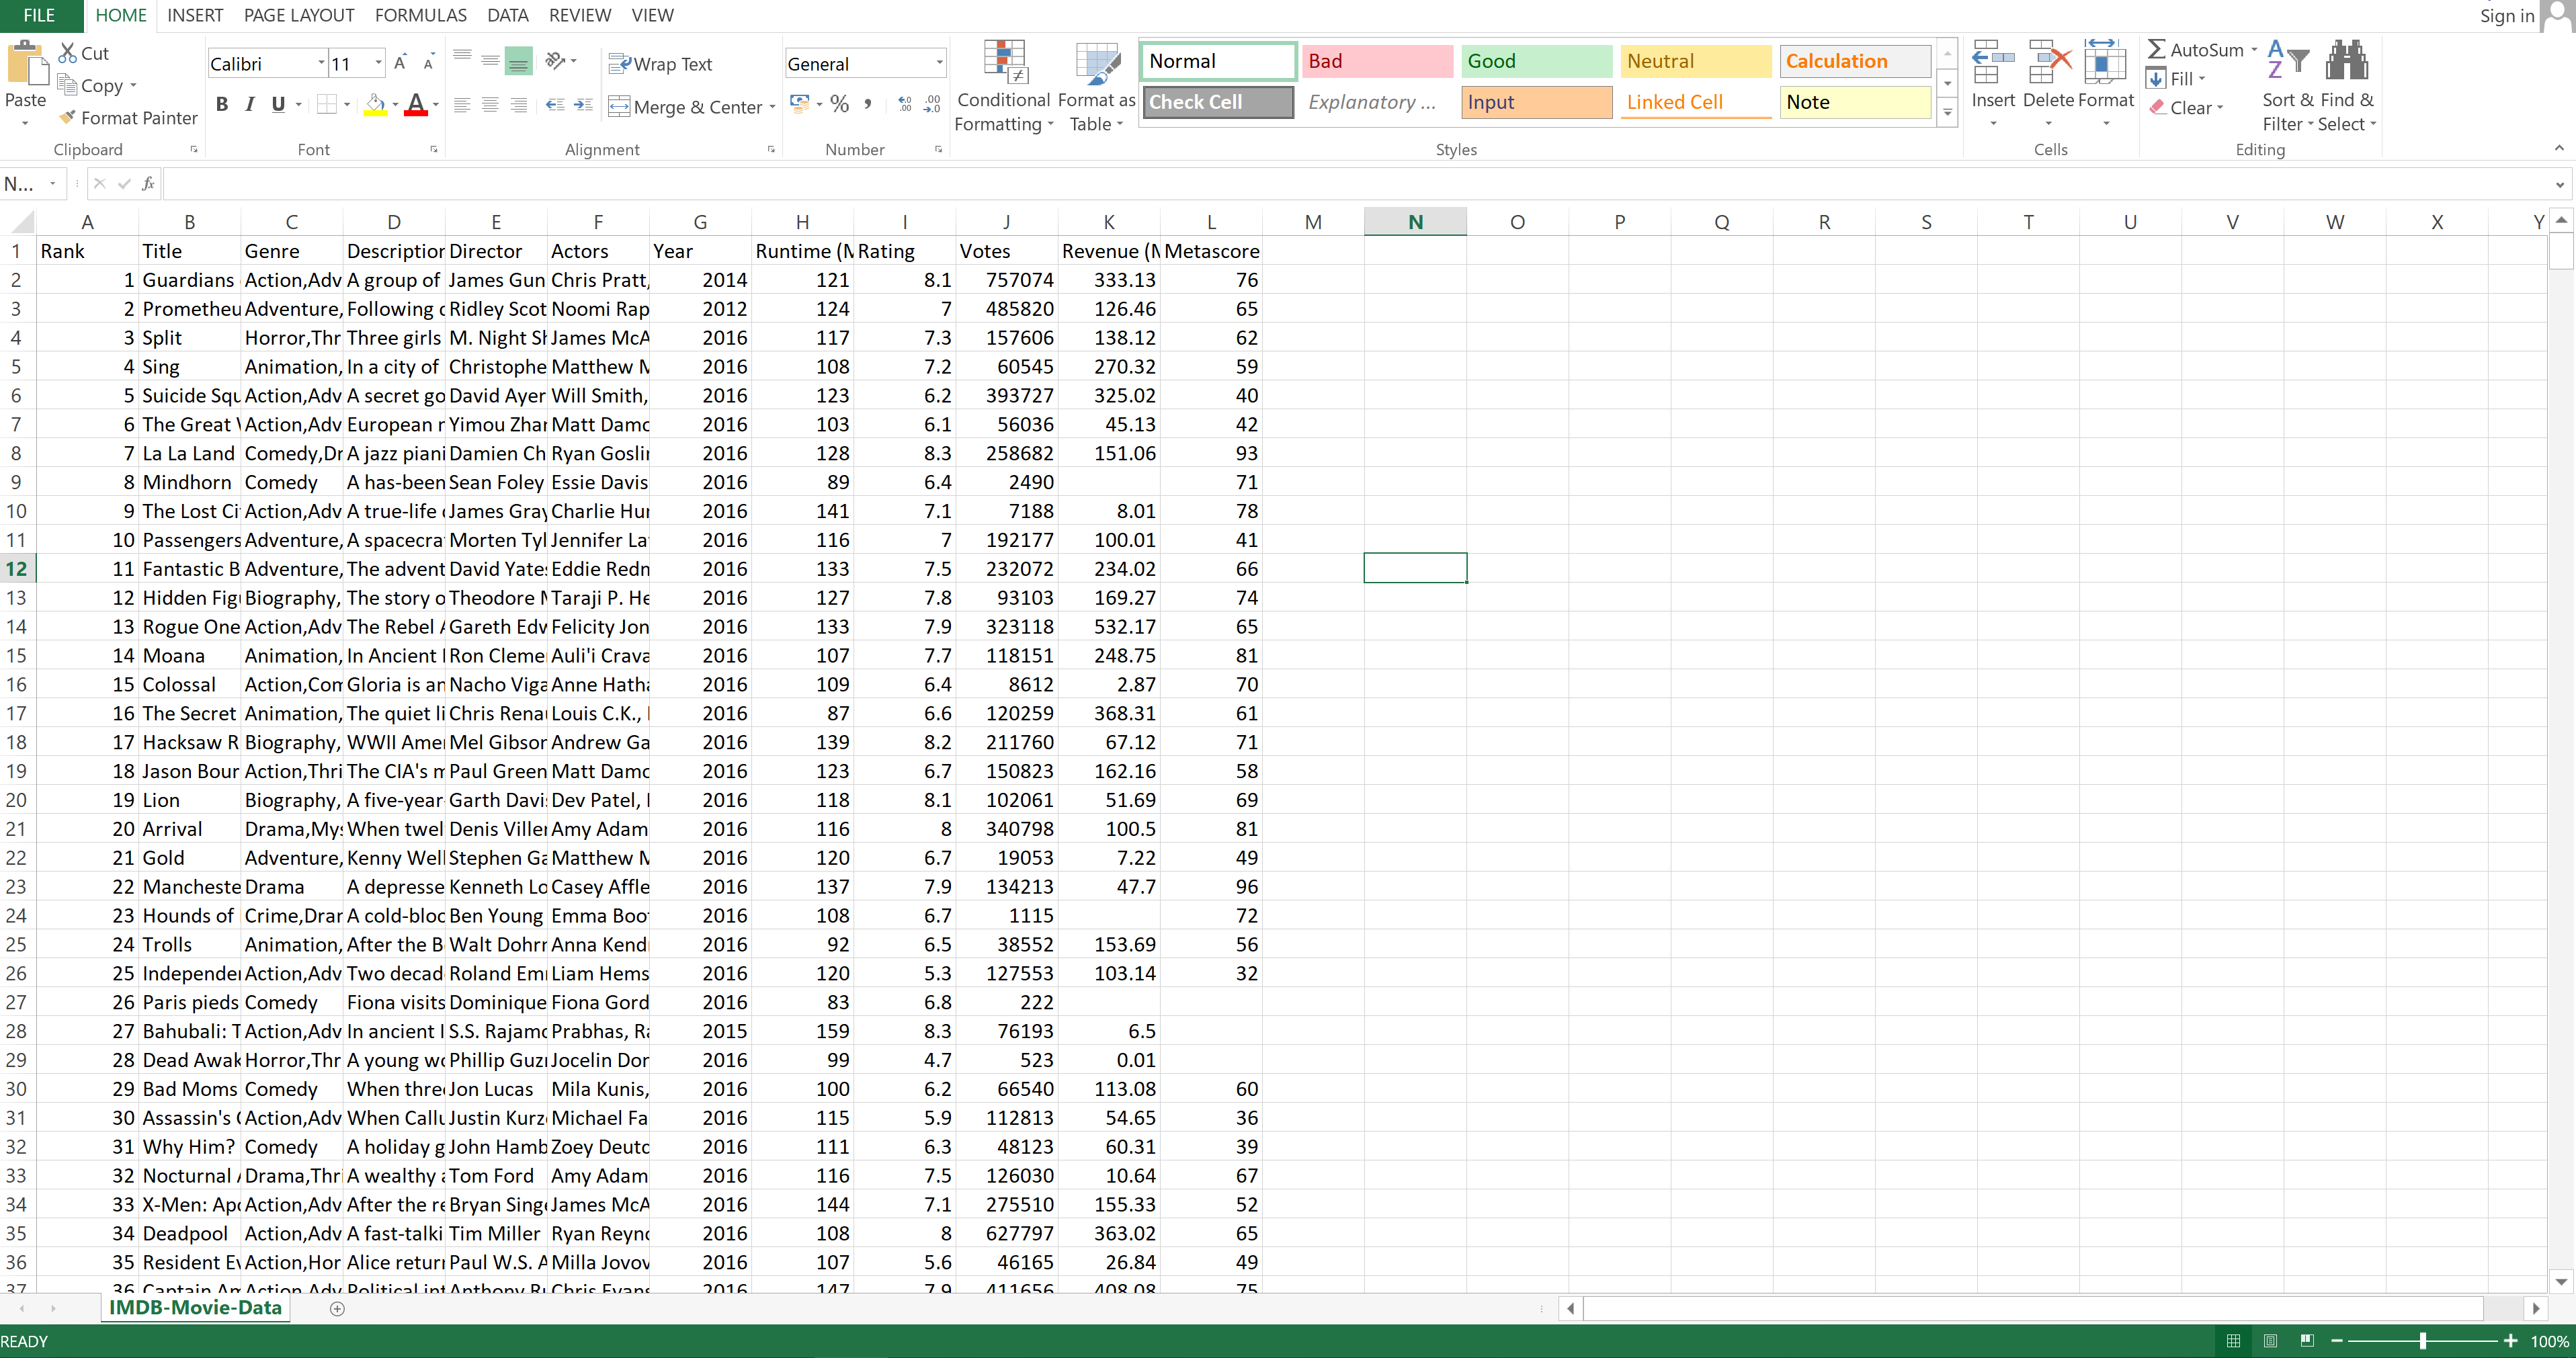
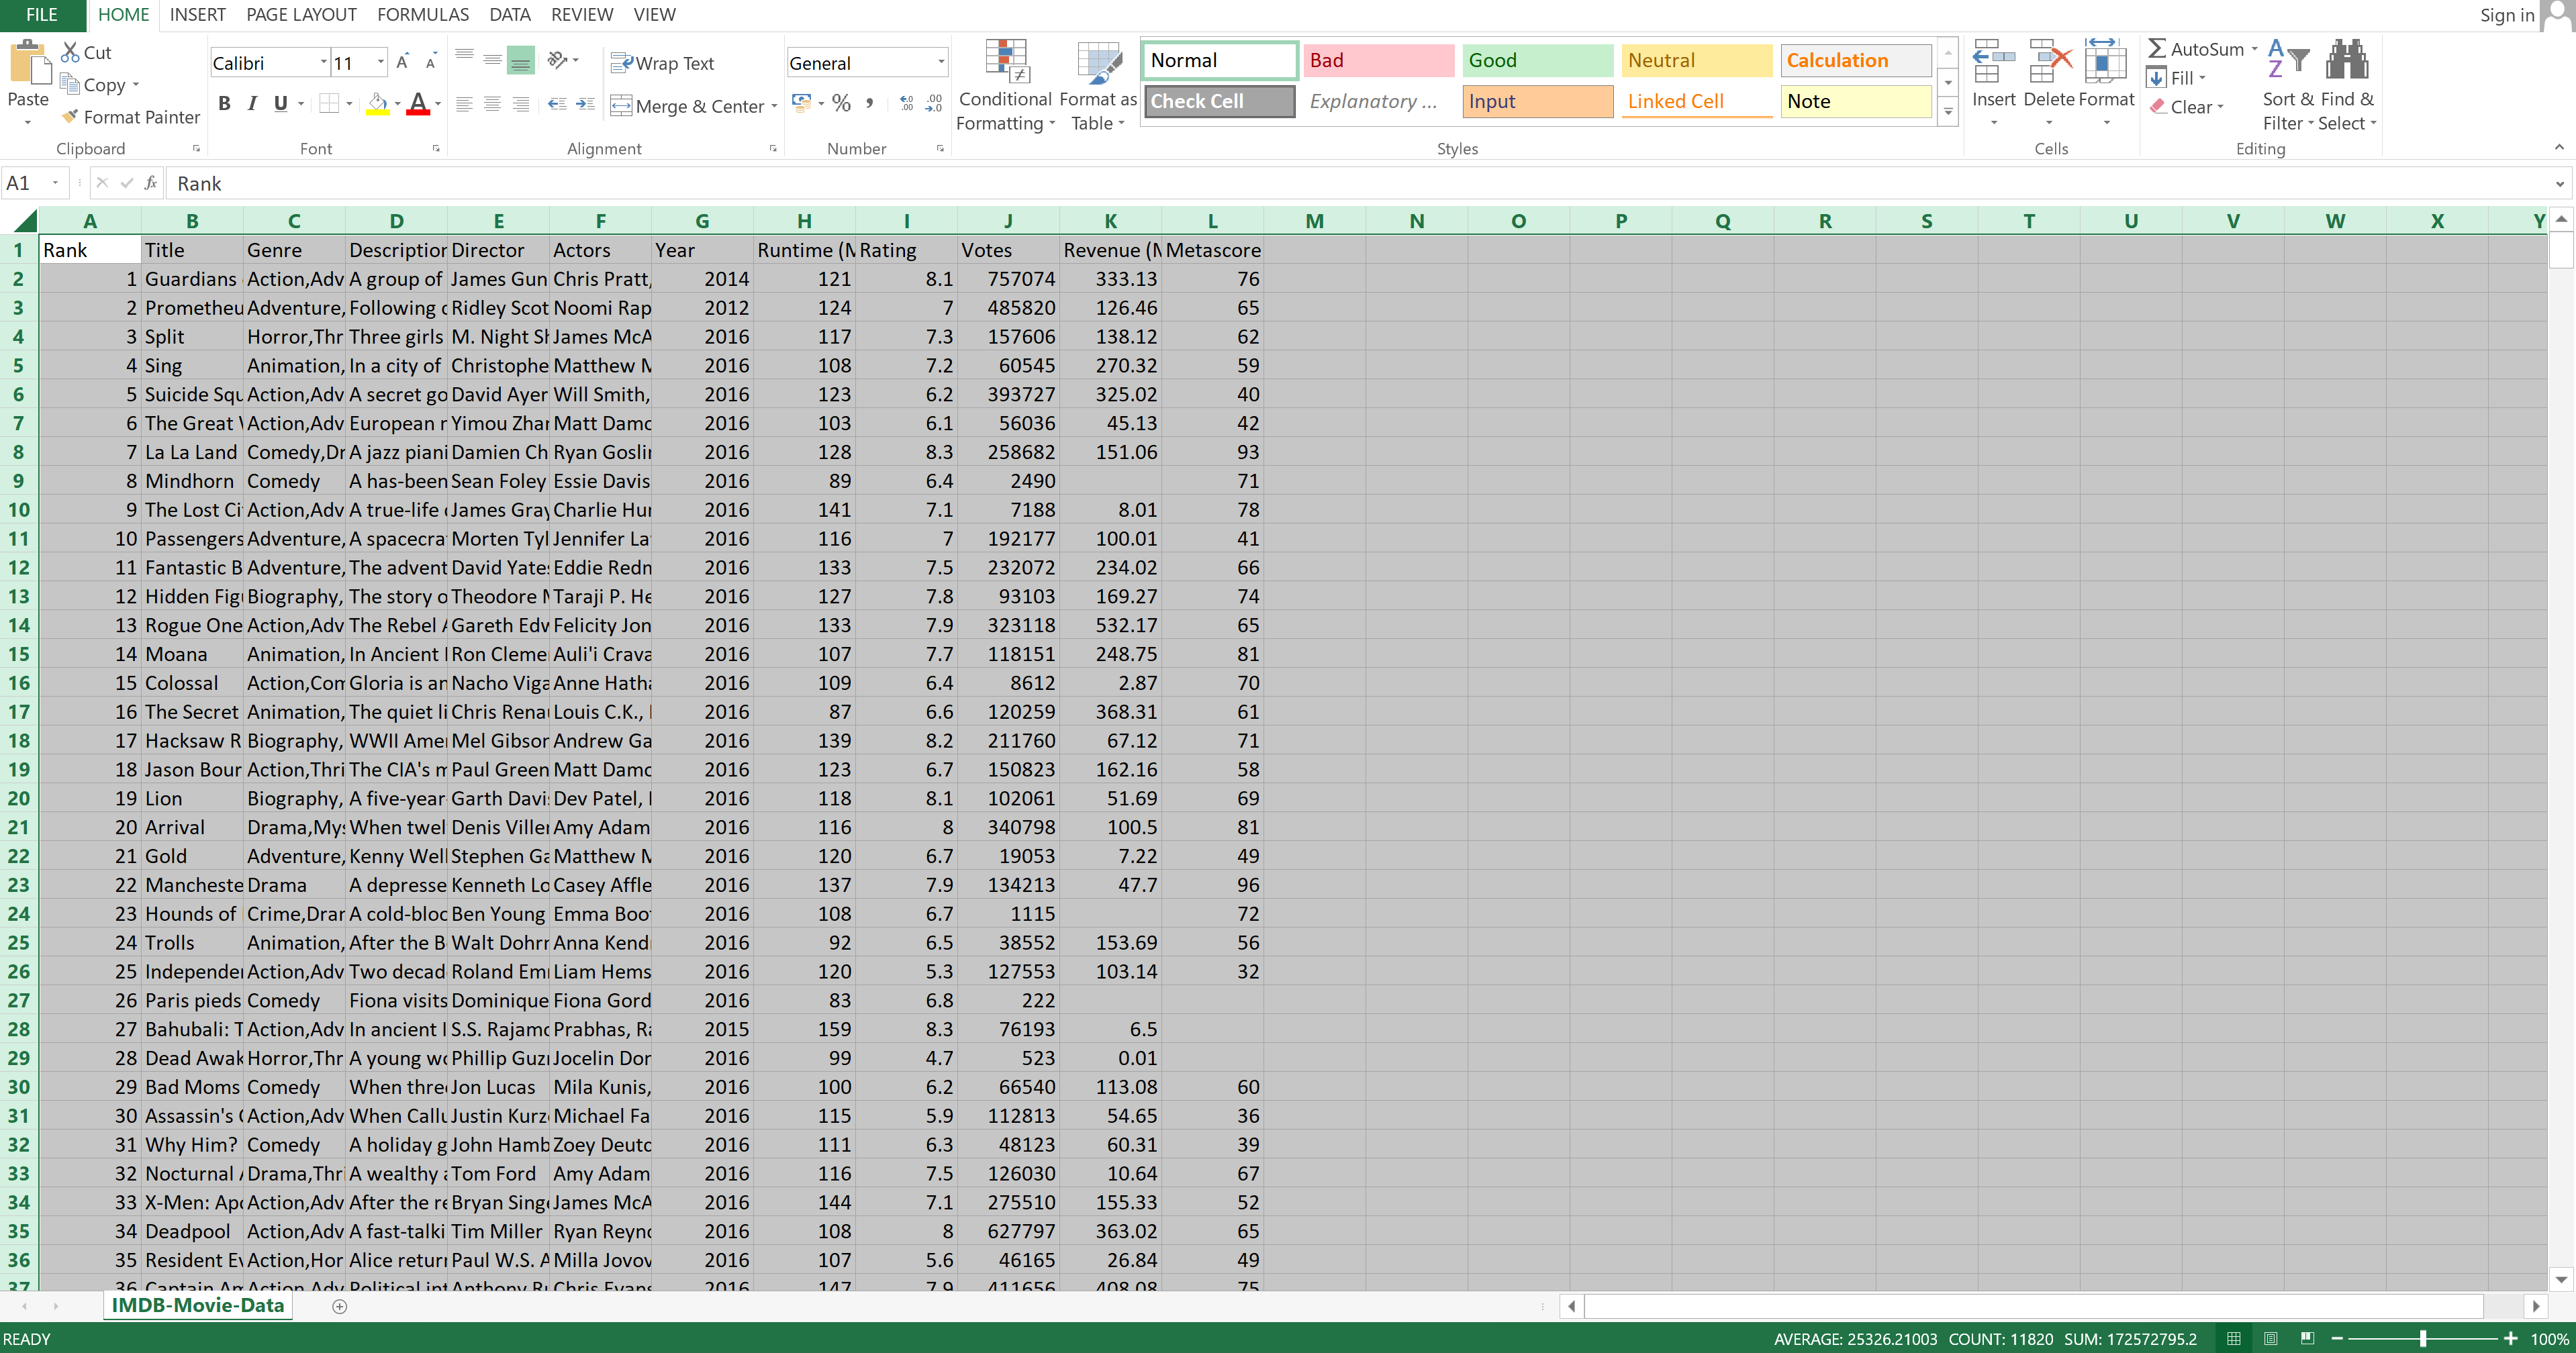
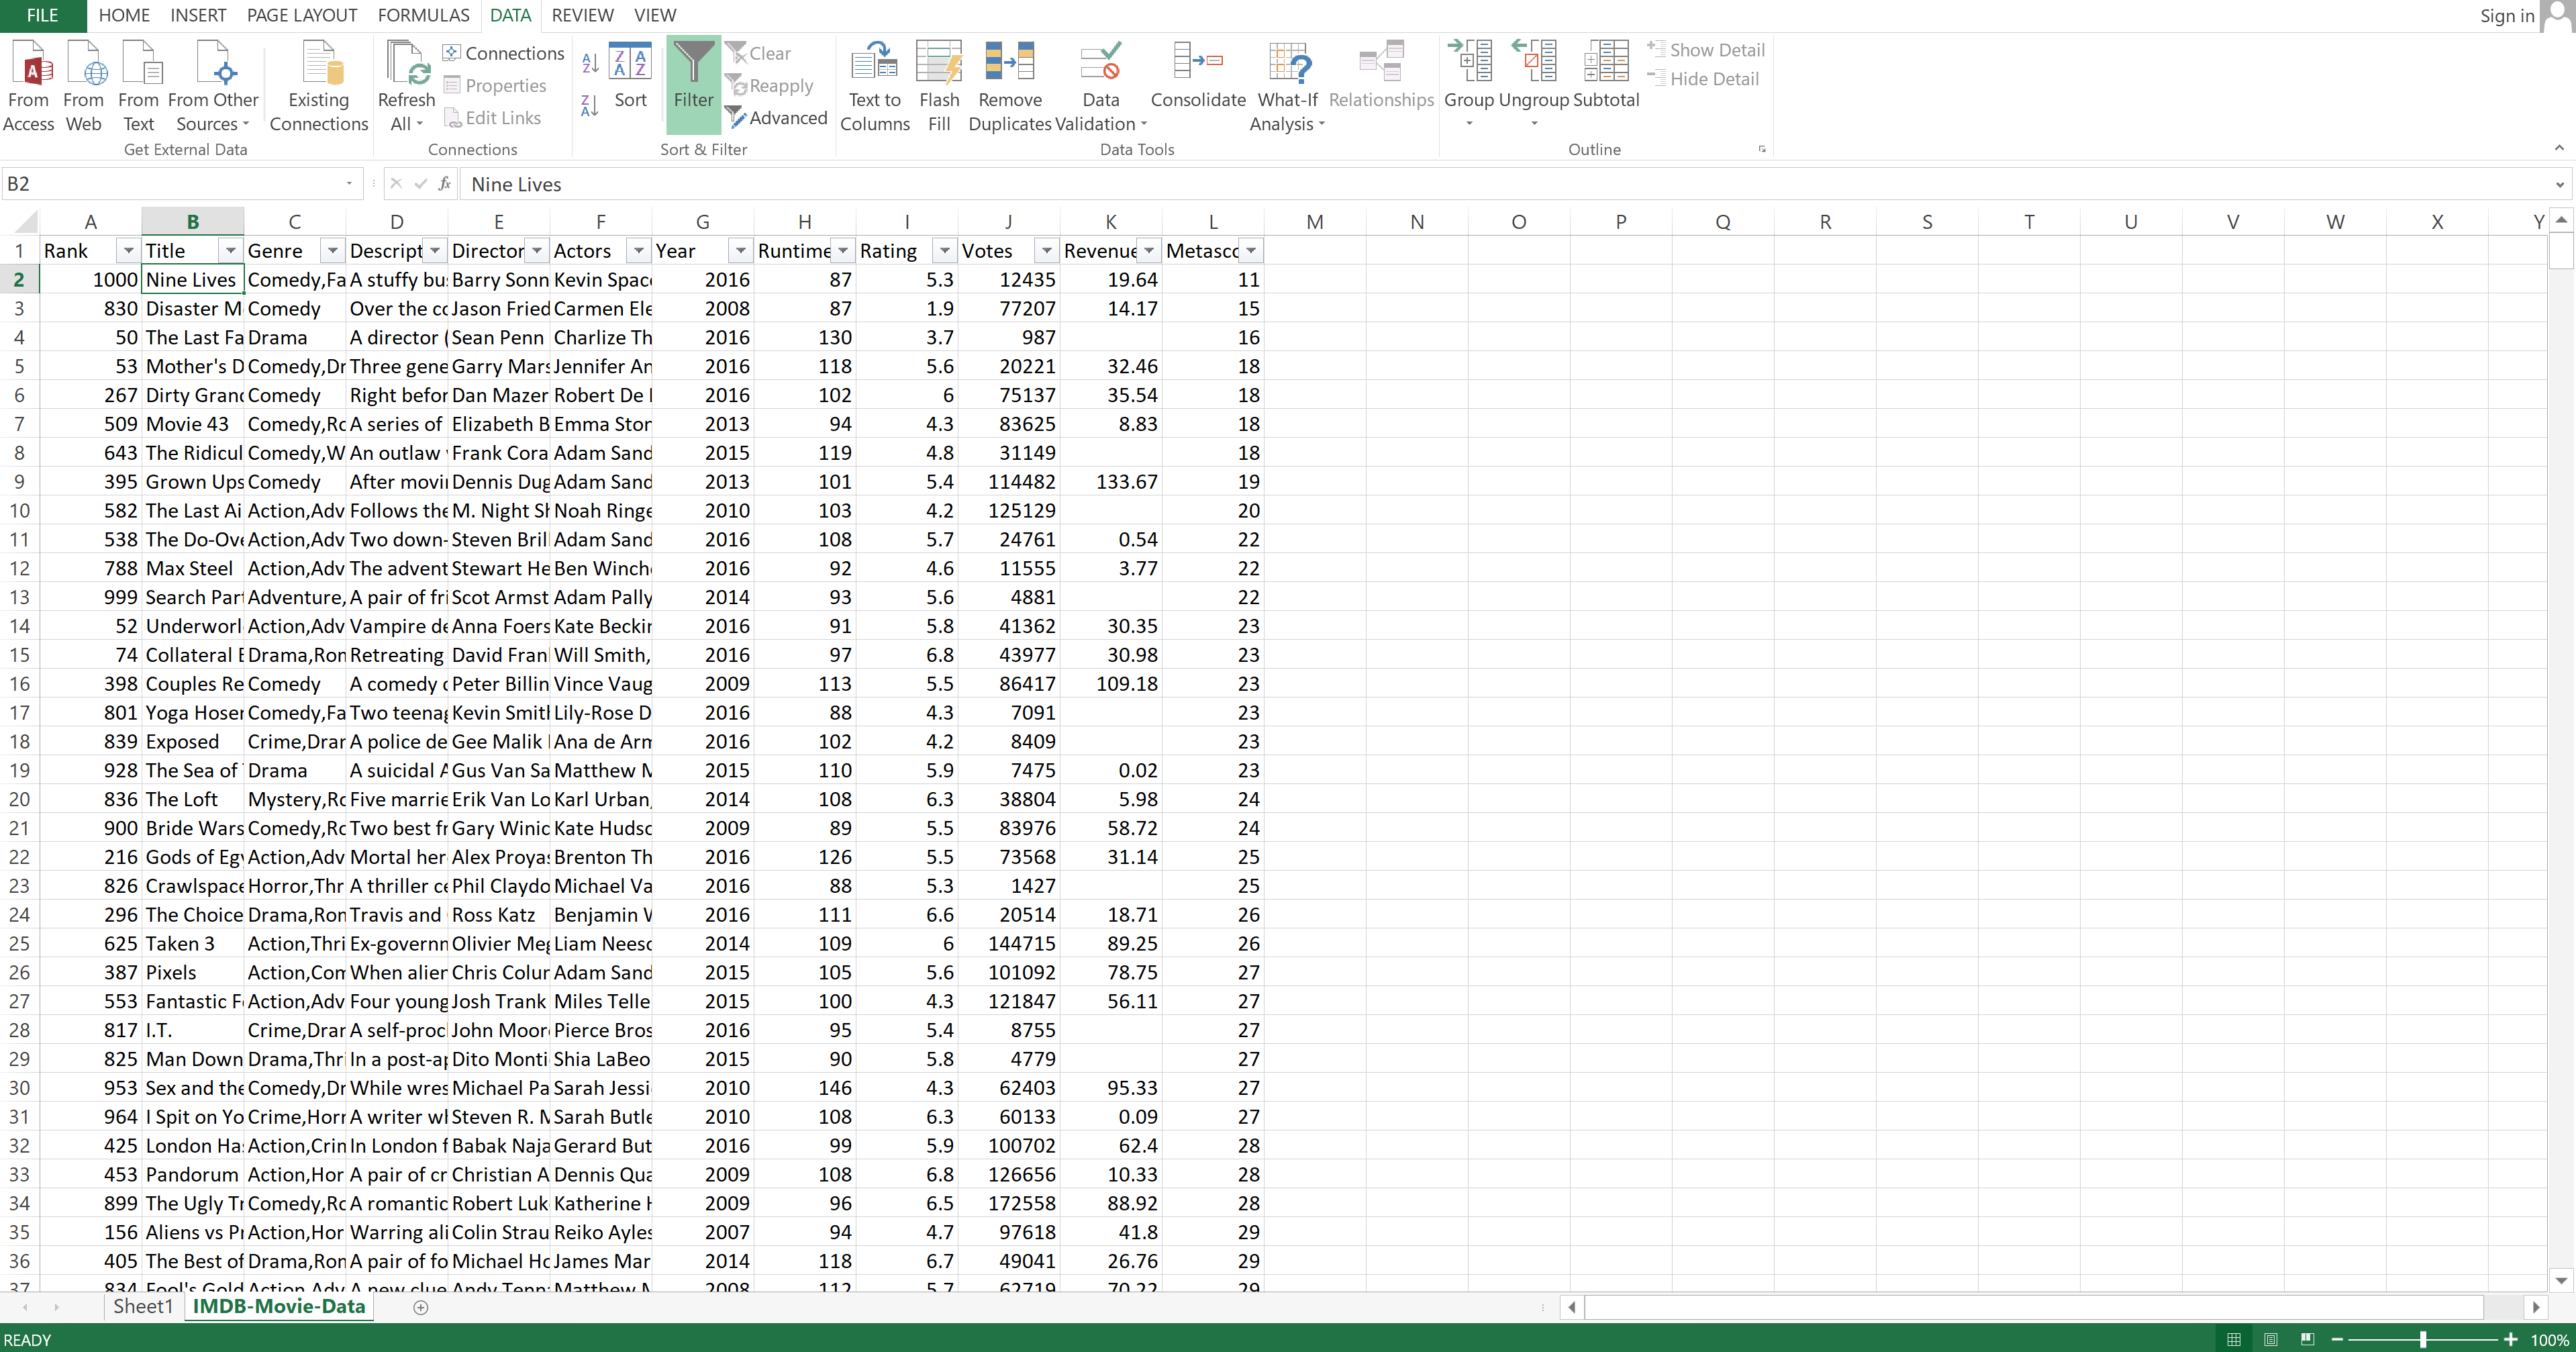
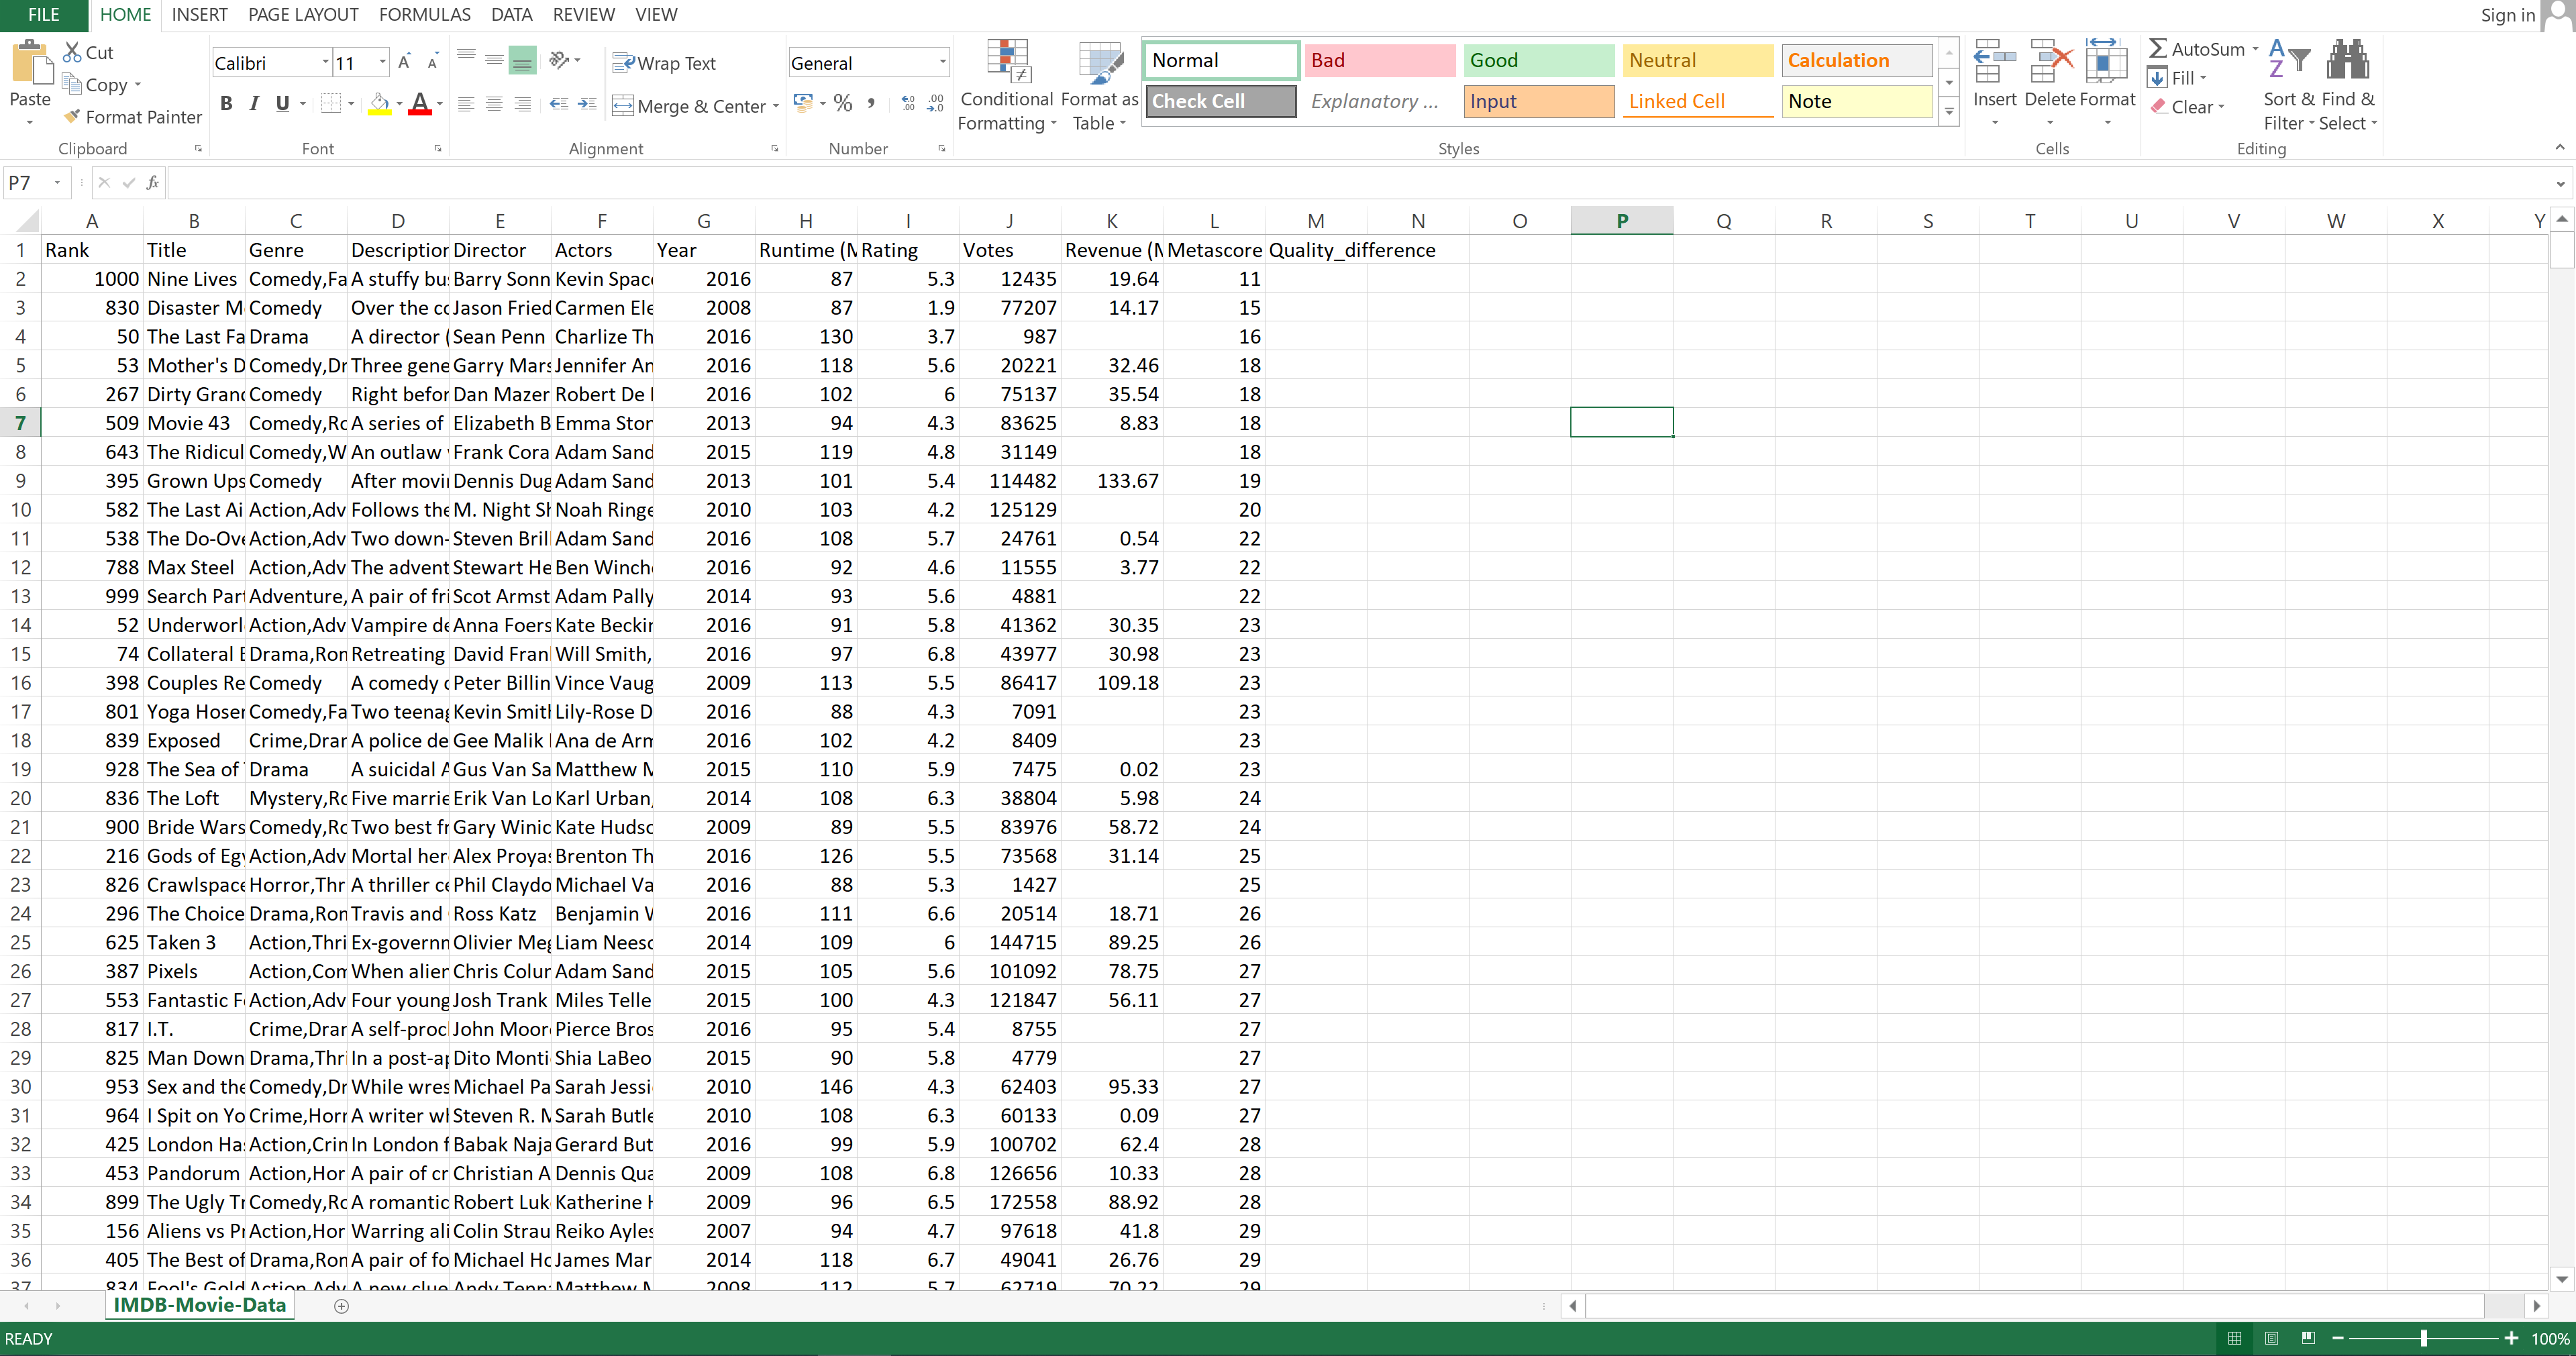
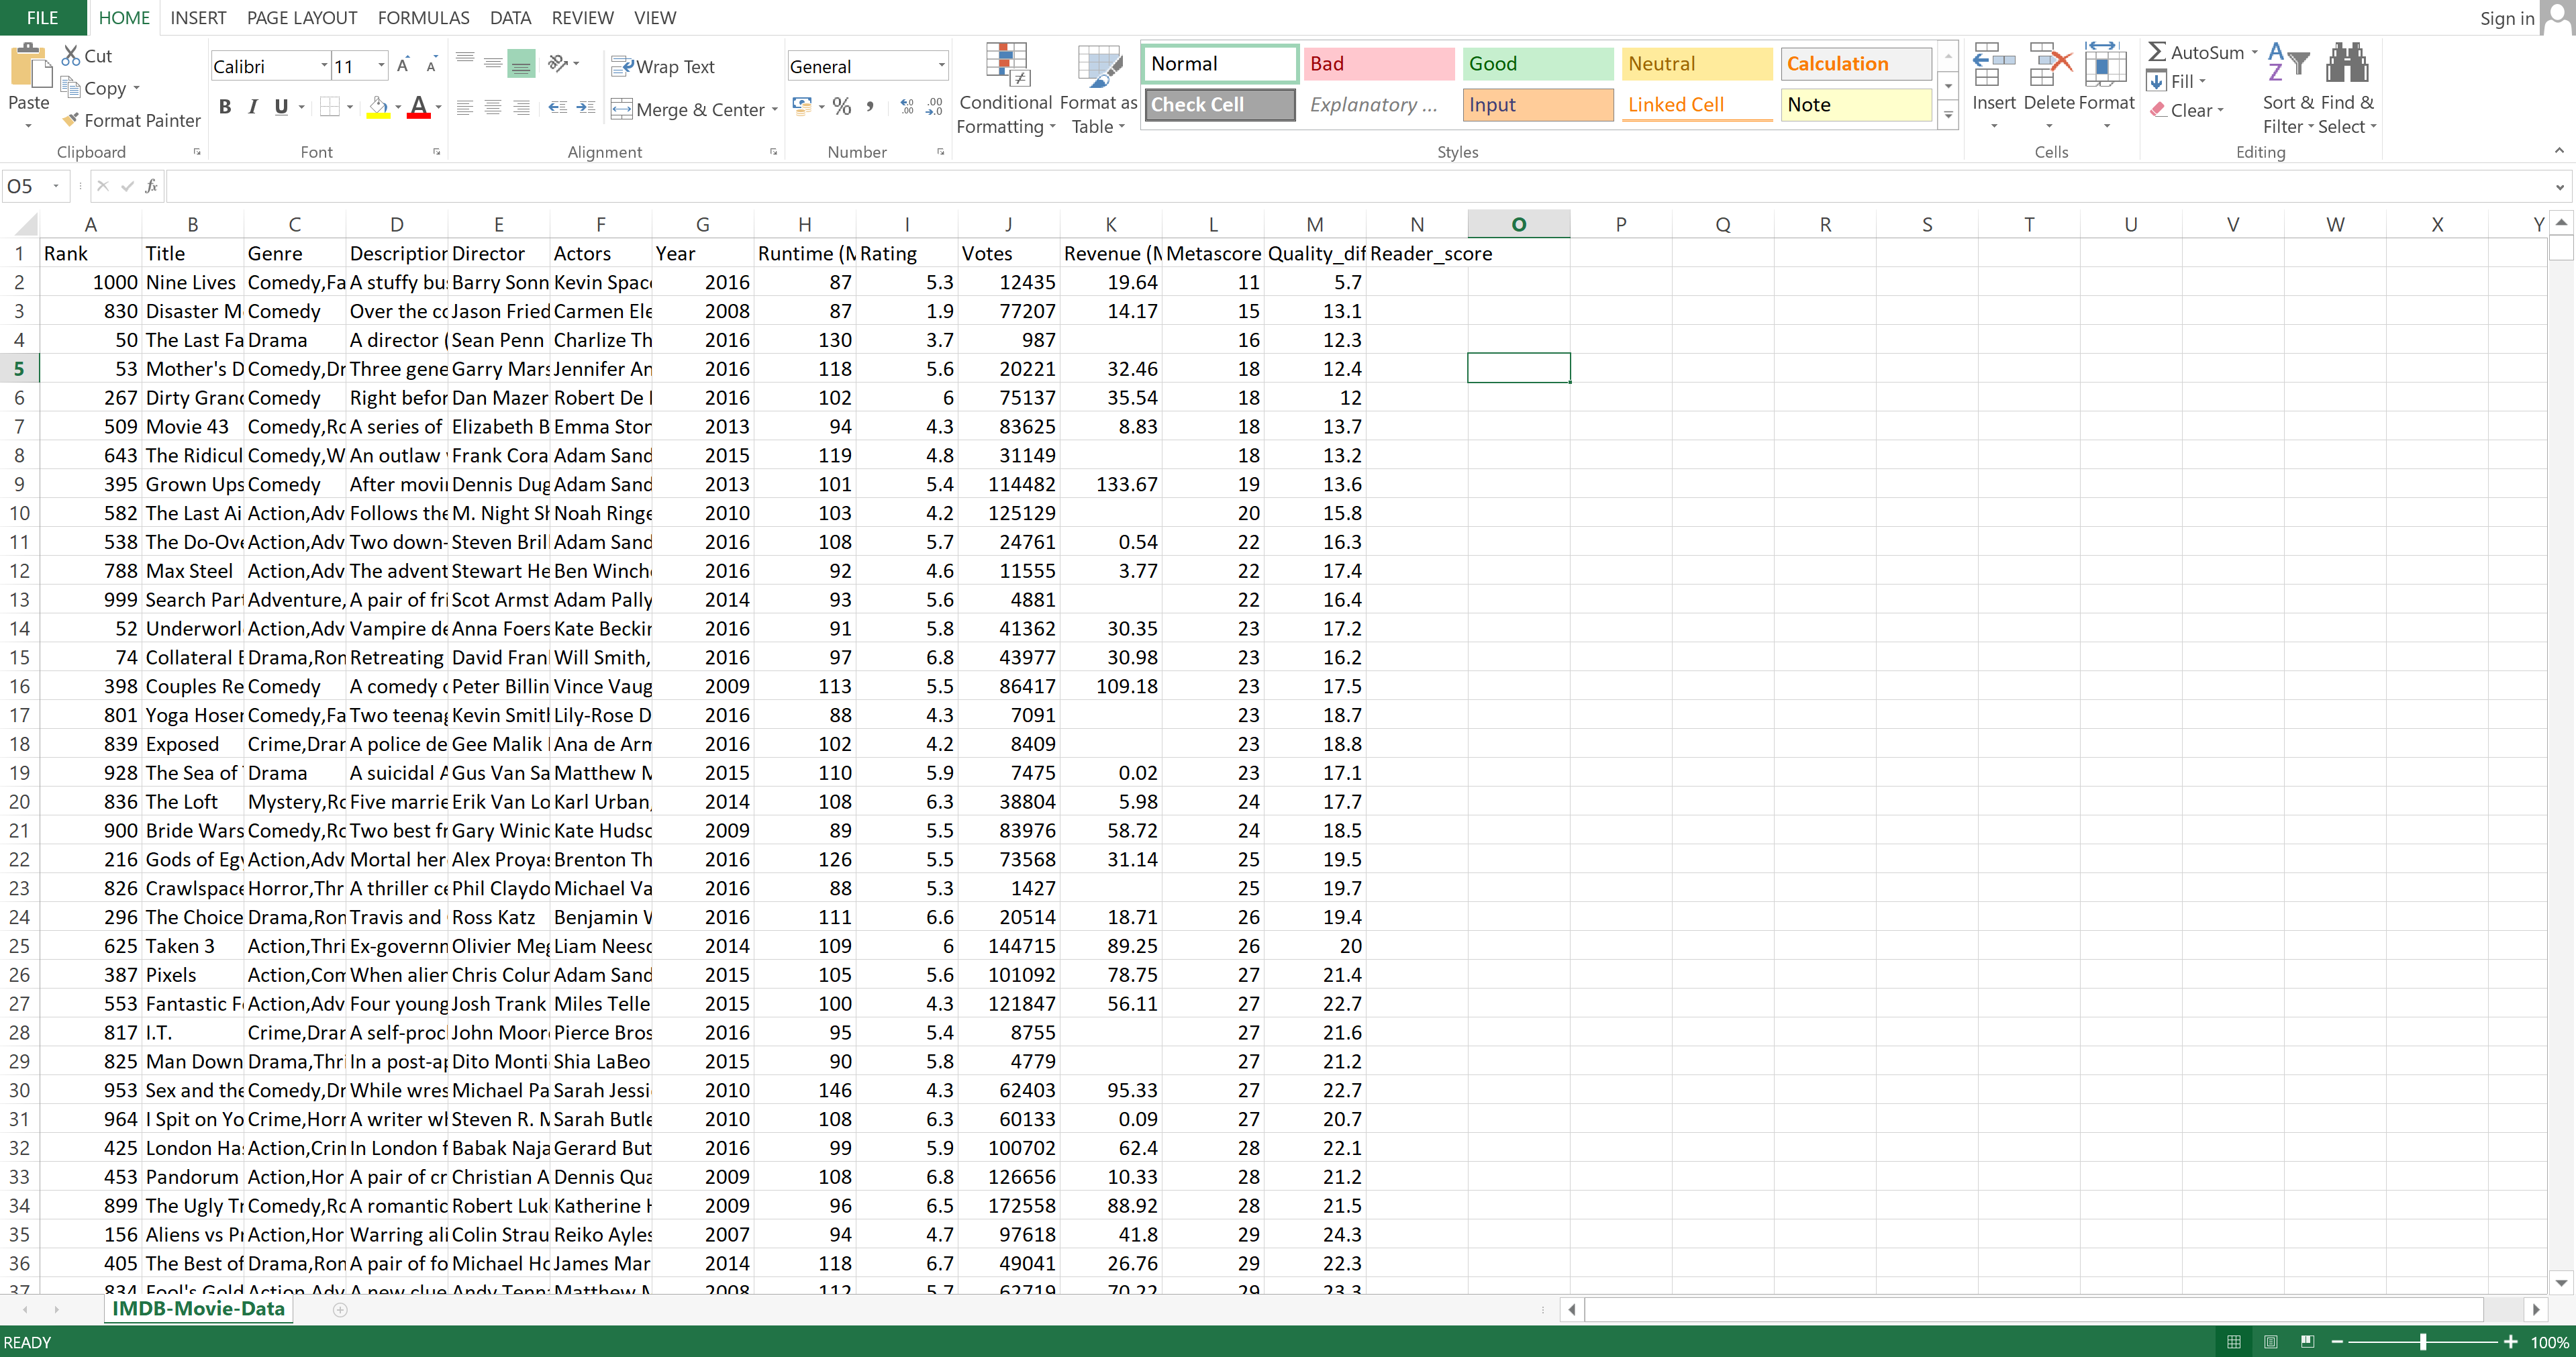
In Excel, data is represented as an Excel spreadsheet. That spreadsheet contains columns, rows, and cells. There are no special commands for looking at a spreadsheet. It is automatically there when you open a file that is in a compatible format.
Let's take a look at the spreadsheet that represents the dataset:
Image Source: Excel Imdb-Movie-Data Set, Edlitera
Pandas
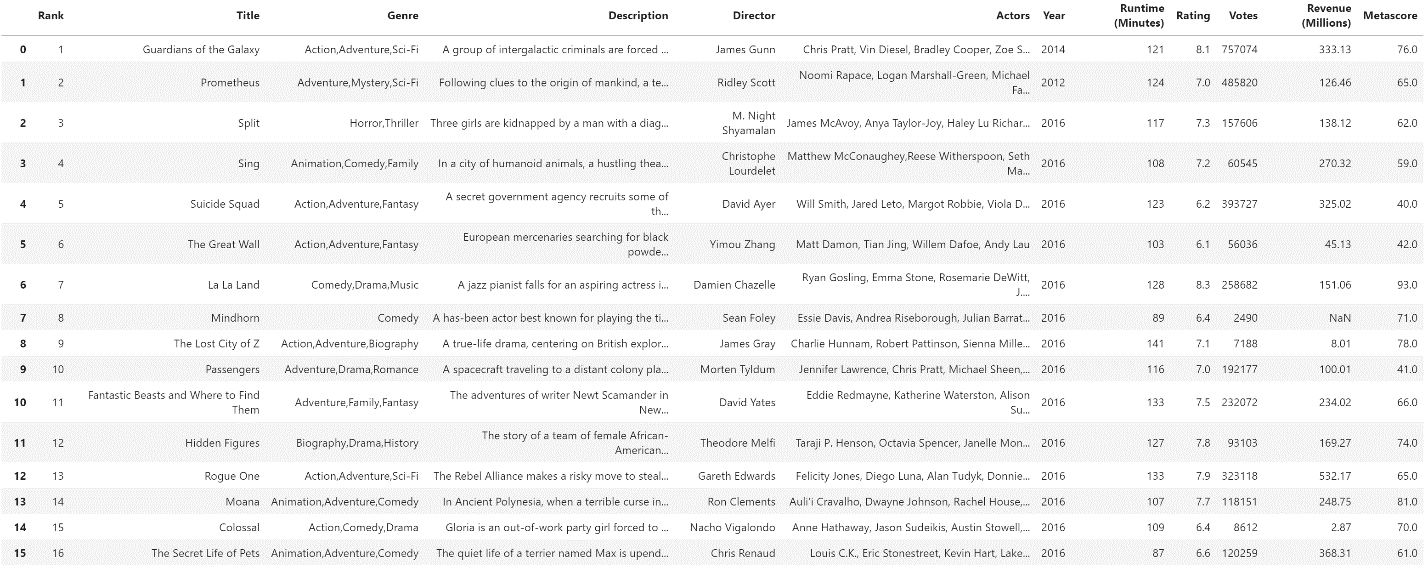
In Pandas, you read data from tables using the appropriate read method. For example, if you want to read an Excel file, you are going to use the read_excel method. Because the used data in this example is in the form of a CSV file, you should use the read_csv method. When you read data, you store your data in what they call a DataFrame to make sure you can easily access it. To look at your data, you are going to create a DataFrame and name it movies. Once your DataFrame is created, you can look at it. To do that, you use the head() method. By default, it shows the top five rows, but for this example, let's display the top 16 rows.
Code:
movies = pd.read_csv("IMDB-Movie-data.csv")
movies.head(16)Result:
Image Source: Pandas Imdb-Movies-Data Set, Edlitera
Selecting Data
Excel
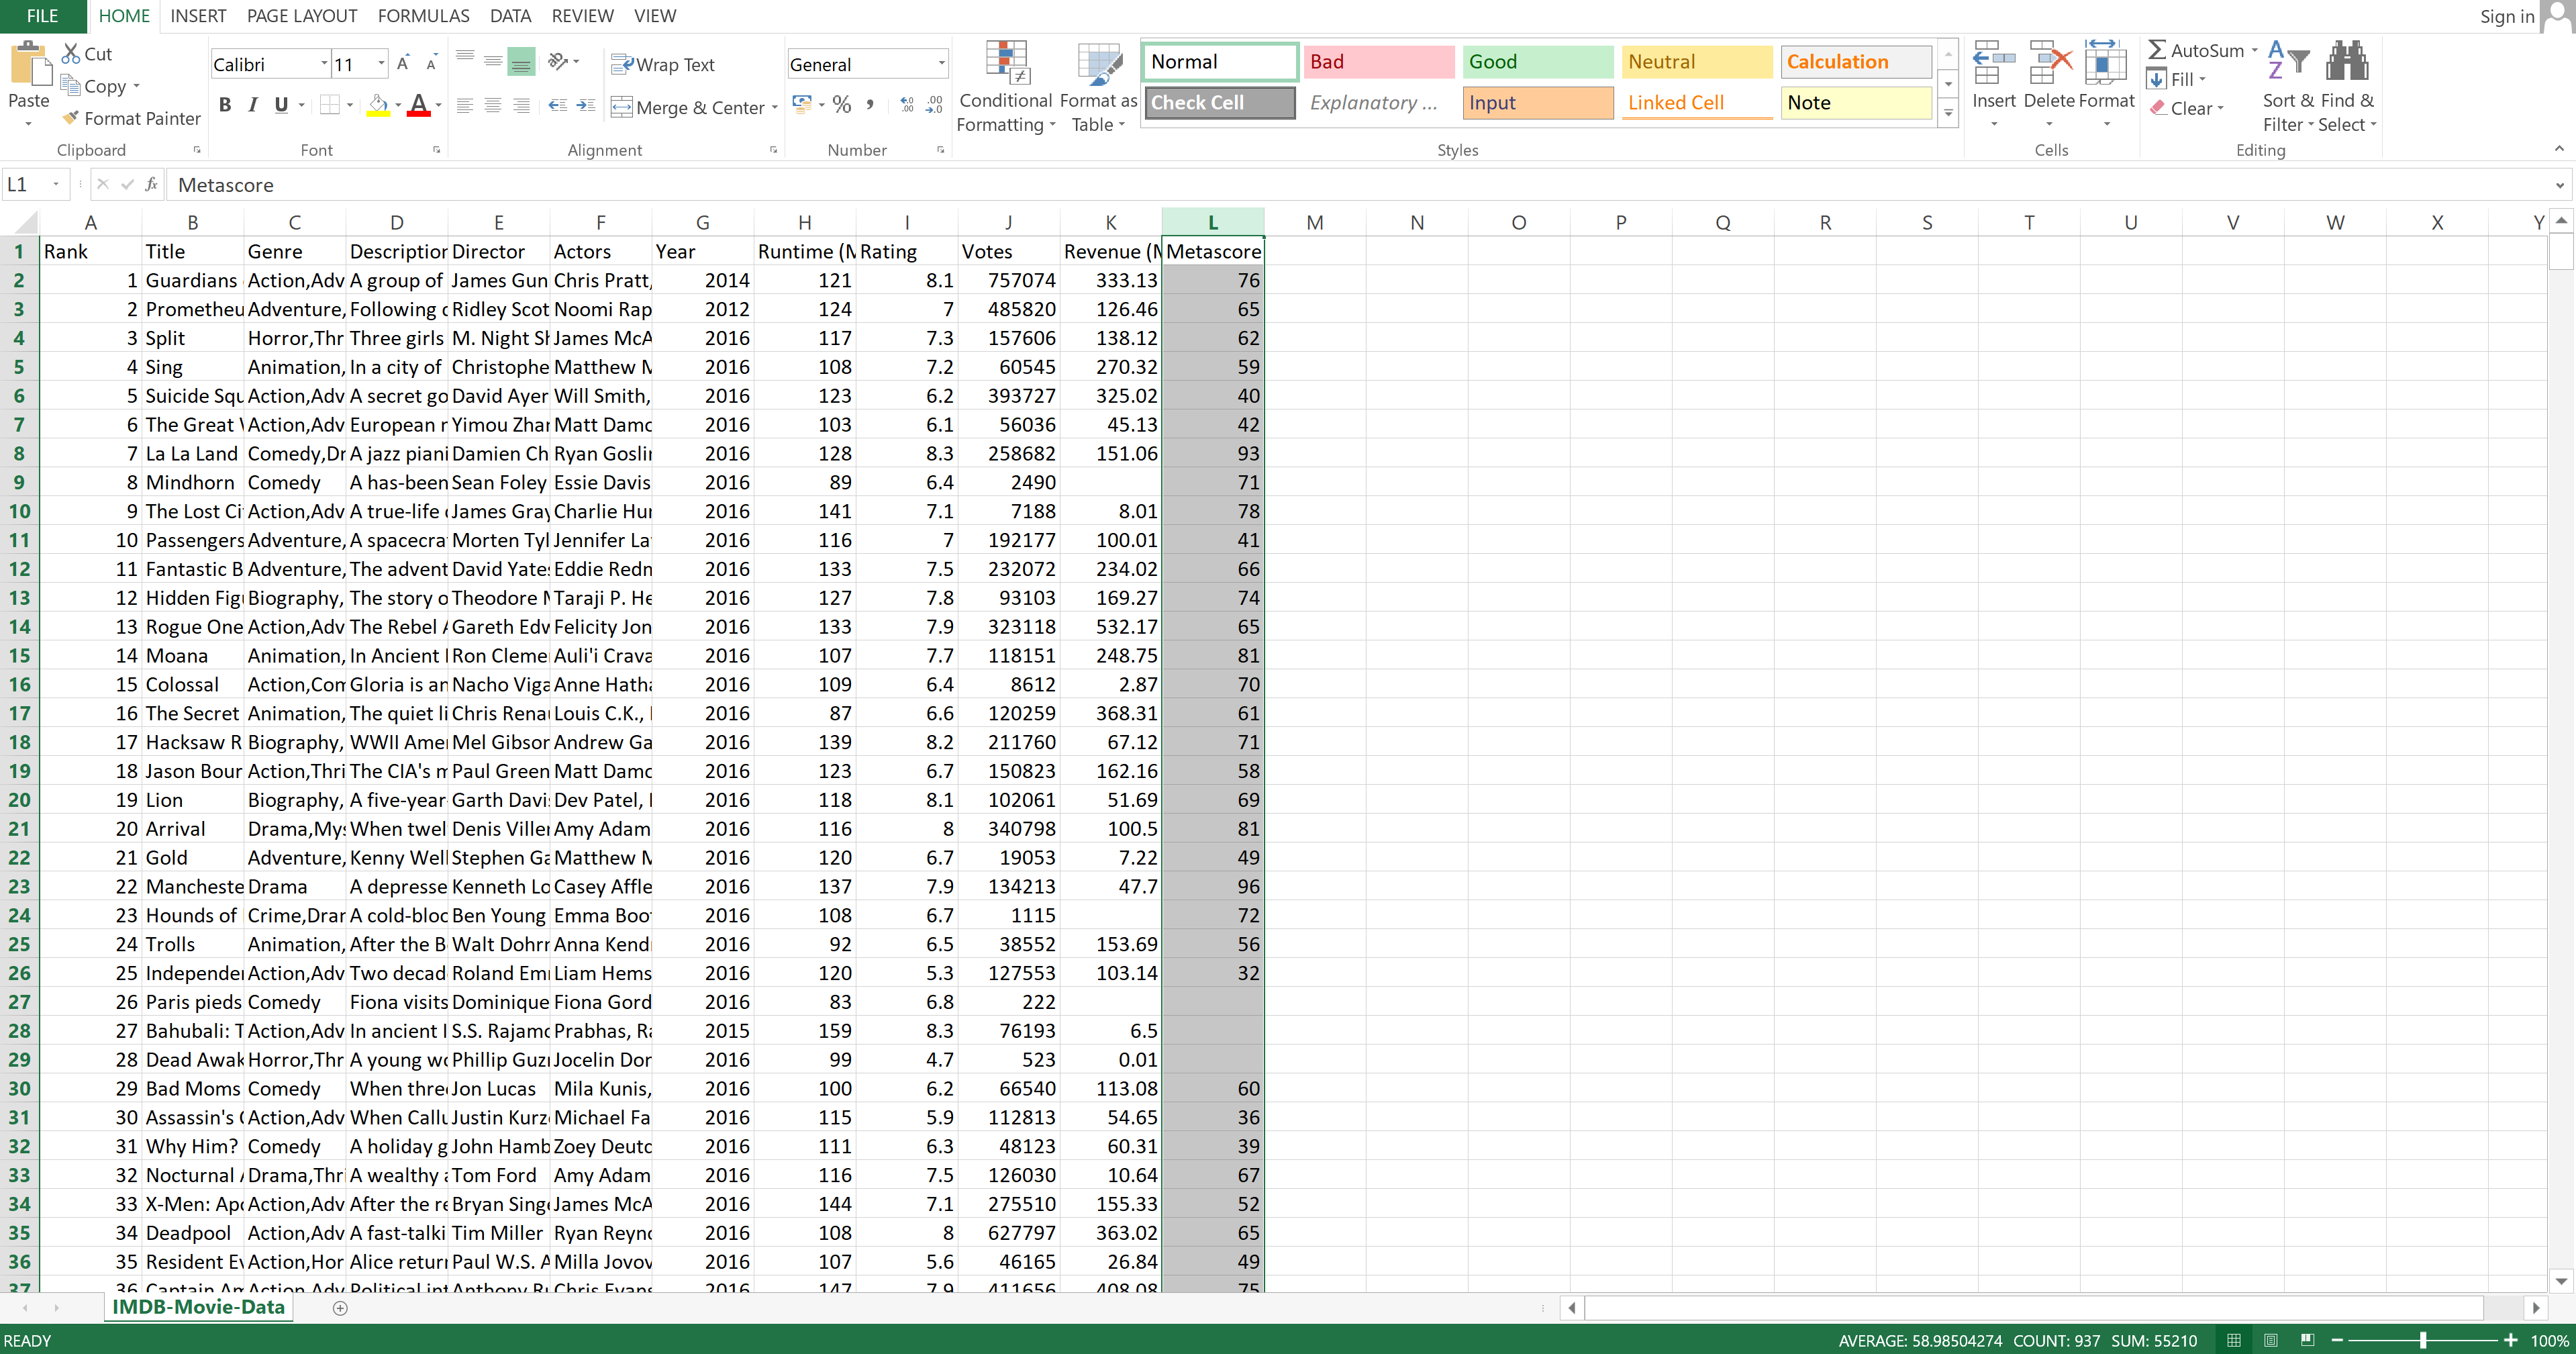
It is very easy to select data in Excel. You can use keyboard shortcuts or even just click with a mouse. Let's select the Metascore column by clicking on it:
Image Source: Excel Imdb-Movie-Data Set, Edlitera
Pandas
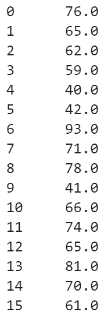
Selecting data in Pandas is very straightforward. First, you write the name of your DataFrame, and then follow that up with the name of the column you want to select in square brackets. Let's select the same columns you selected in Excel, the Metascore column.
Code:
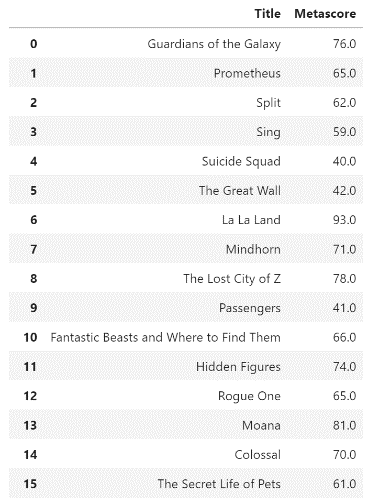
movies["Metascore"]Result:
Selecting multiple columns is also easy. You just need to enter the name of the columns you want to select.
Code:
movies[["Title", "Metascore"]]Result:
Article continues below
Want to learn more? Check out some of our courses:
Sorting Data
Excel
To demonstrate how sorting works, let's sort the data based on the Metascore column in ascending order.
To sort data in Excel, you need to select the data that you want to sort:
Image Source: Excel Imdb-Movie-Data Set, Edlitera
Afterward, you can click the Sort and Filter button. When given the option to choose how you want to sort, let's select the option to sort the data by the values inside the Metascore column in ascending order.
The result you will get is:
Image Source: Excel Imdb-Movie-Data Set, Edlitera
You successfully sorted your data. The movie with the smallest value in the Metascore column is now the first row of your table.
Pandas
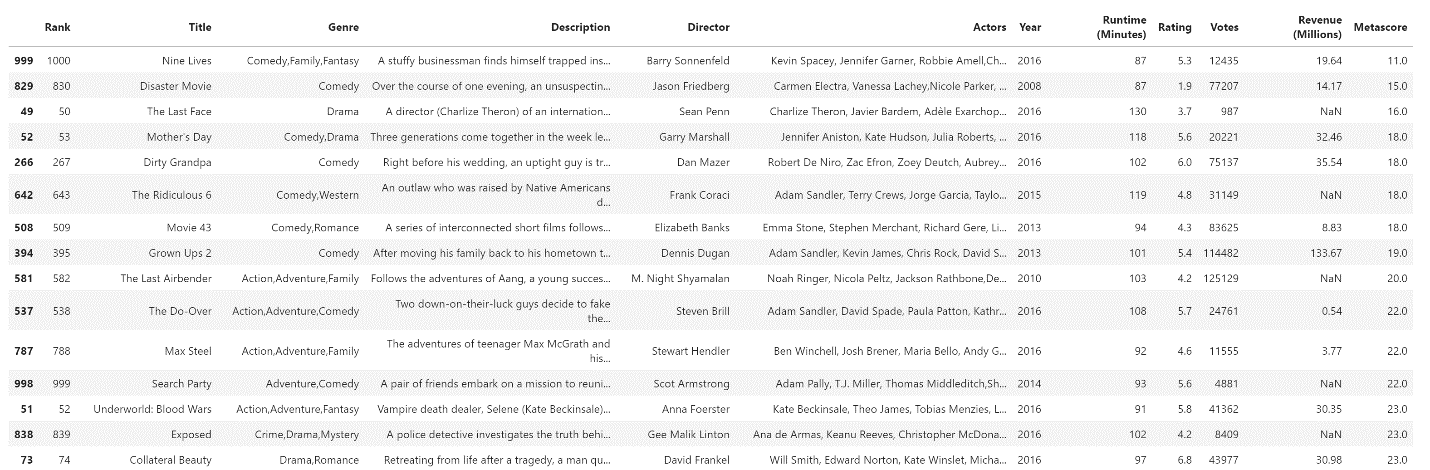
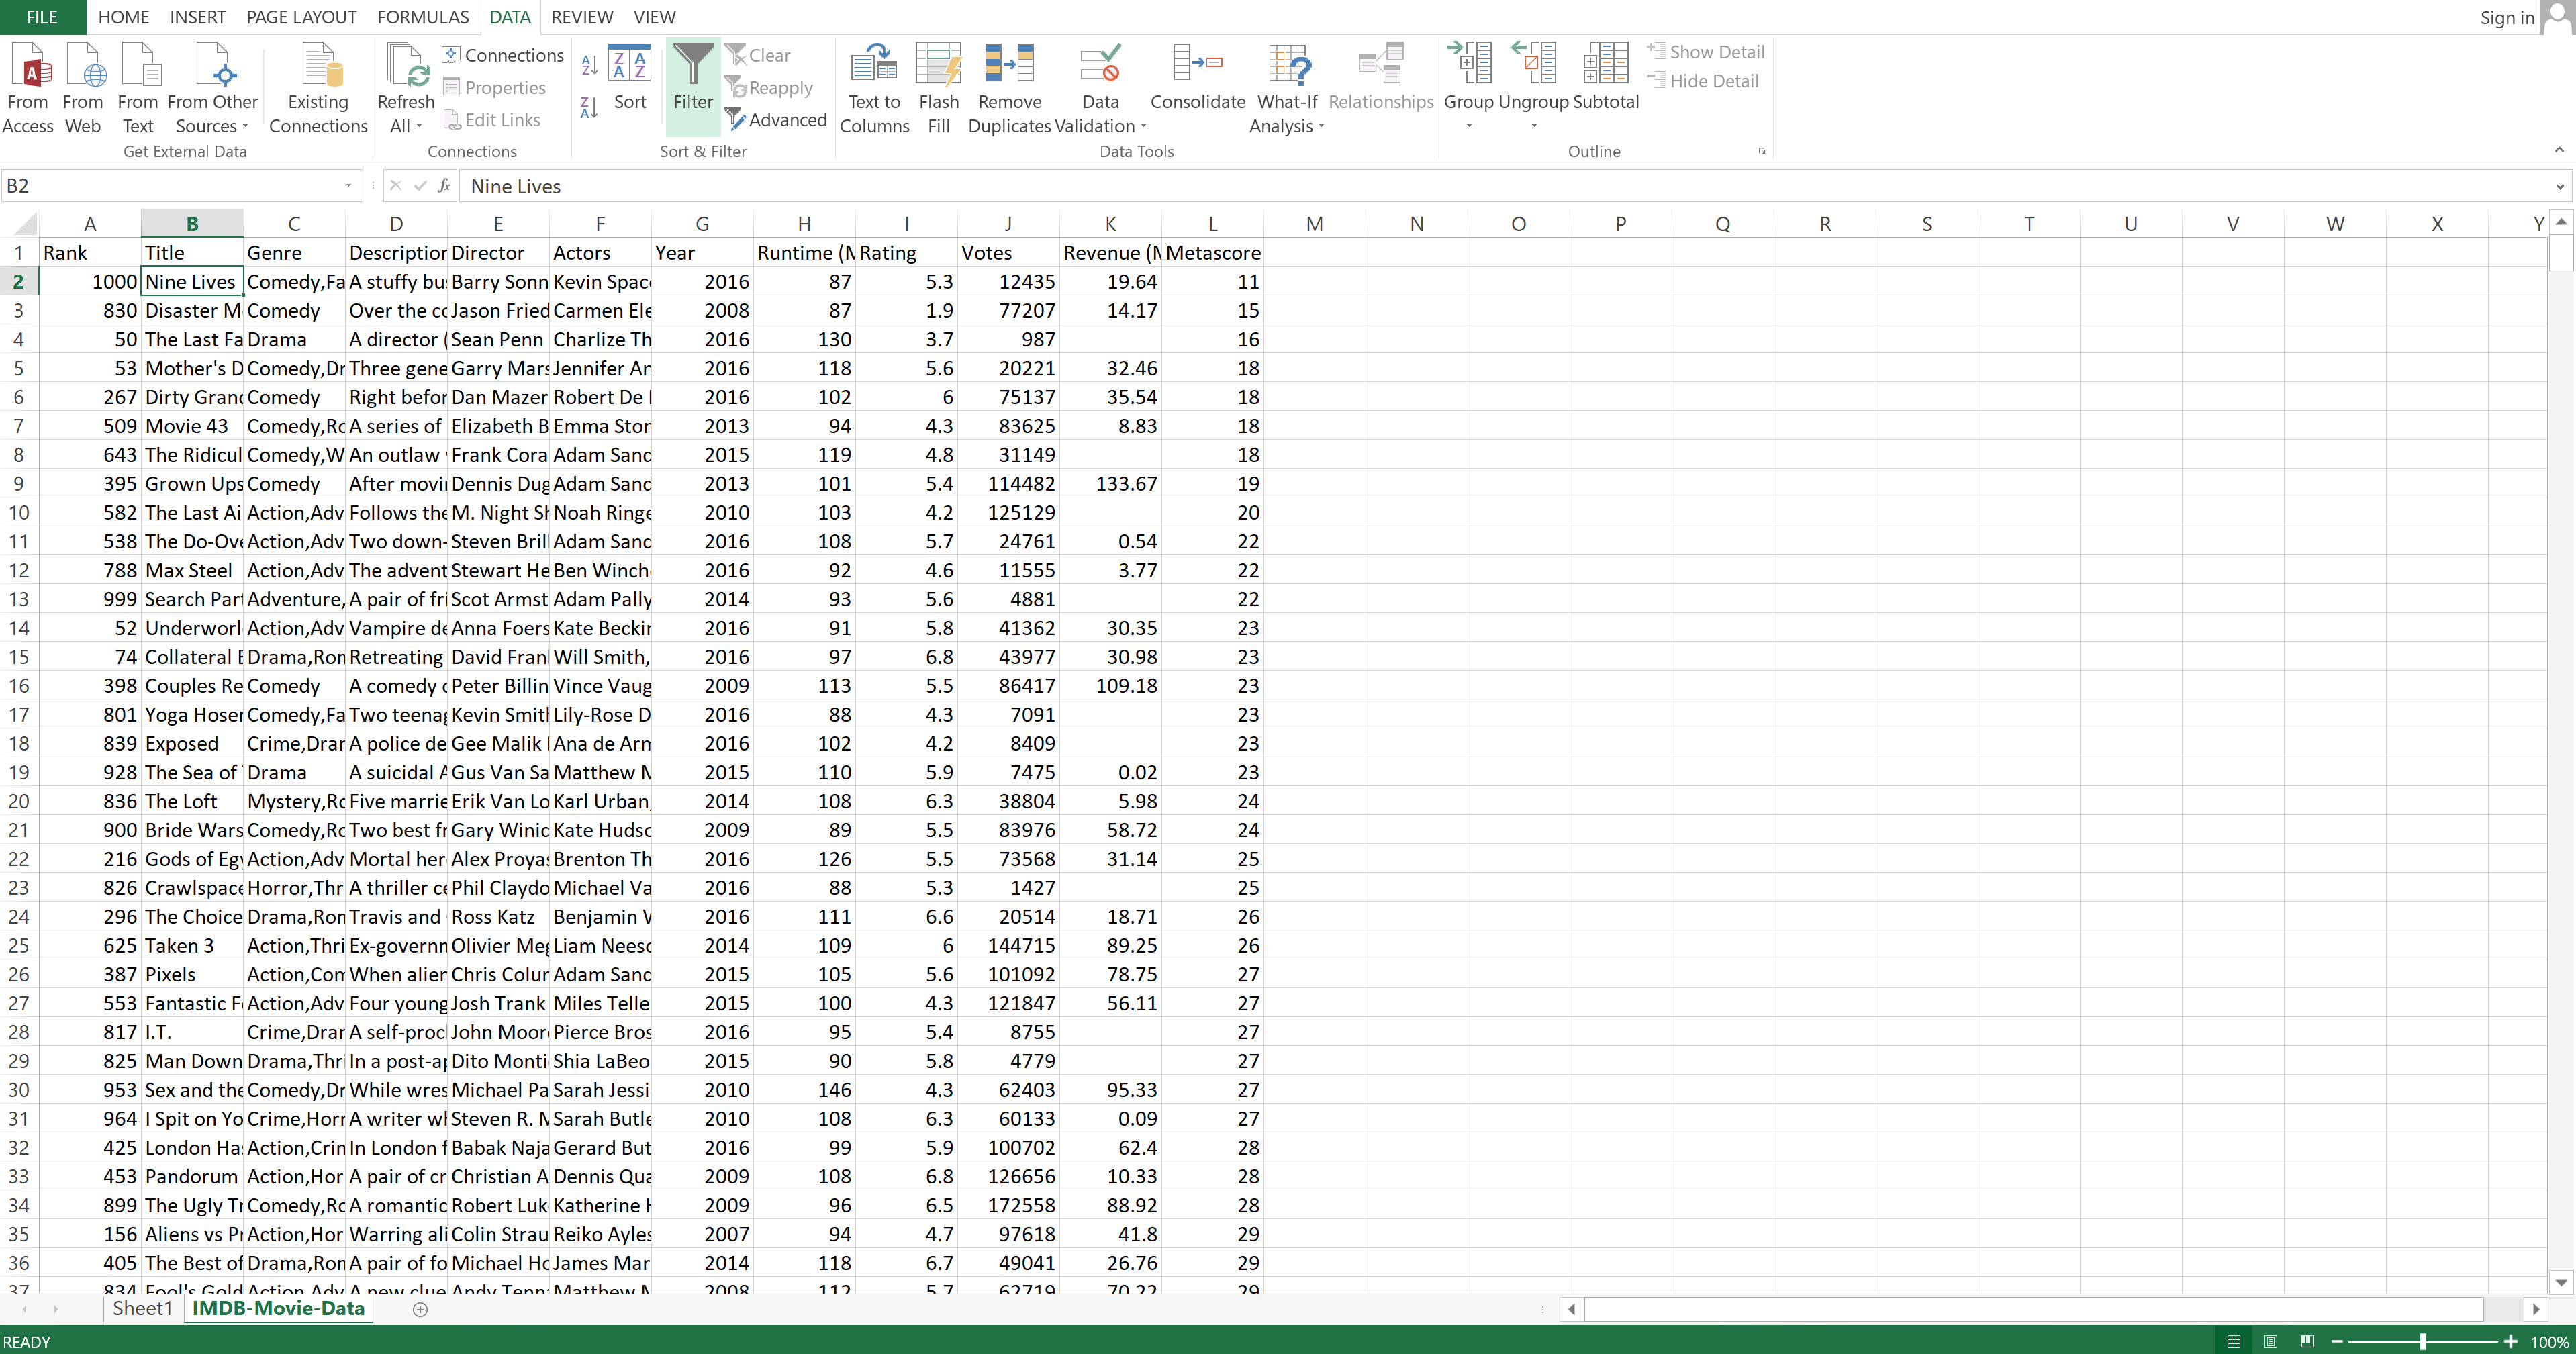
To sort data in Pandas, you will use the sort_values() method. You just need to define the column that you want to sort by. By default, Pandas sorts in ascending order.
Code:
movies.sort_values("Metascore")
Result:
Image Source: Pandas Imdb-Movies-Data Set, Edlitera
Filtering Data
Excel
To demonstrate filtering data, you are going to filter your dataset to show only movies that came out in 2016. First, you need to select the first cell in the "Title" column. Then you need to go to the "Data" tab and click on "Filter".
Image Source: Excel Imdb-Movie-Data Set, Edlitera
You can see little arrows appear next to the column names.
Image Source: Excel Imdb-Movie-Data Set, Edlitera
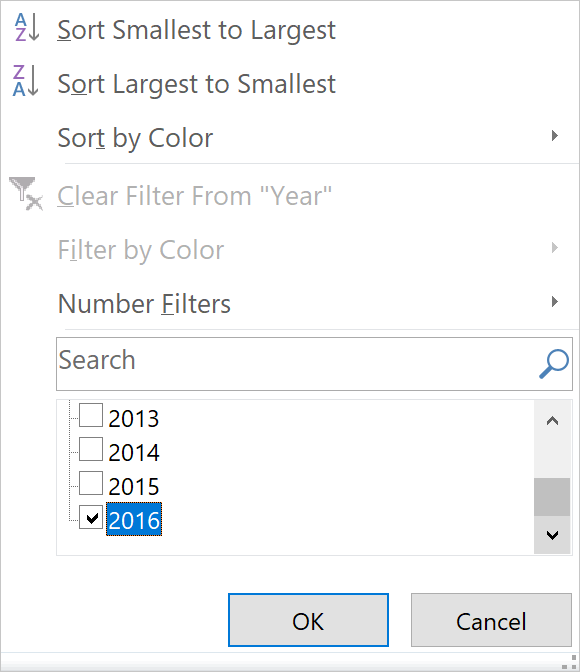
If you click on the arrow next to Year, you will see that currently, all years are selected.

The result you get is a spreadsheet that holds only those rows where the value inside the Year column is 2016.
Image Source: Excel Imdb-Movie-Data Set, Edlitera
Pandas
Filtering data in Pandas is very similar to selecting data. Let's filter the original DataFrame. You need to select the DataFrame you want to filter and then write the condition inside the square brackets.
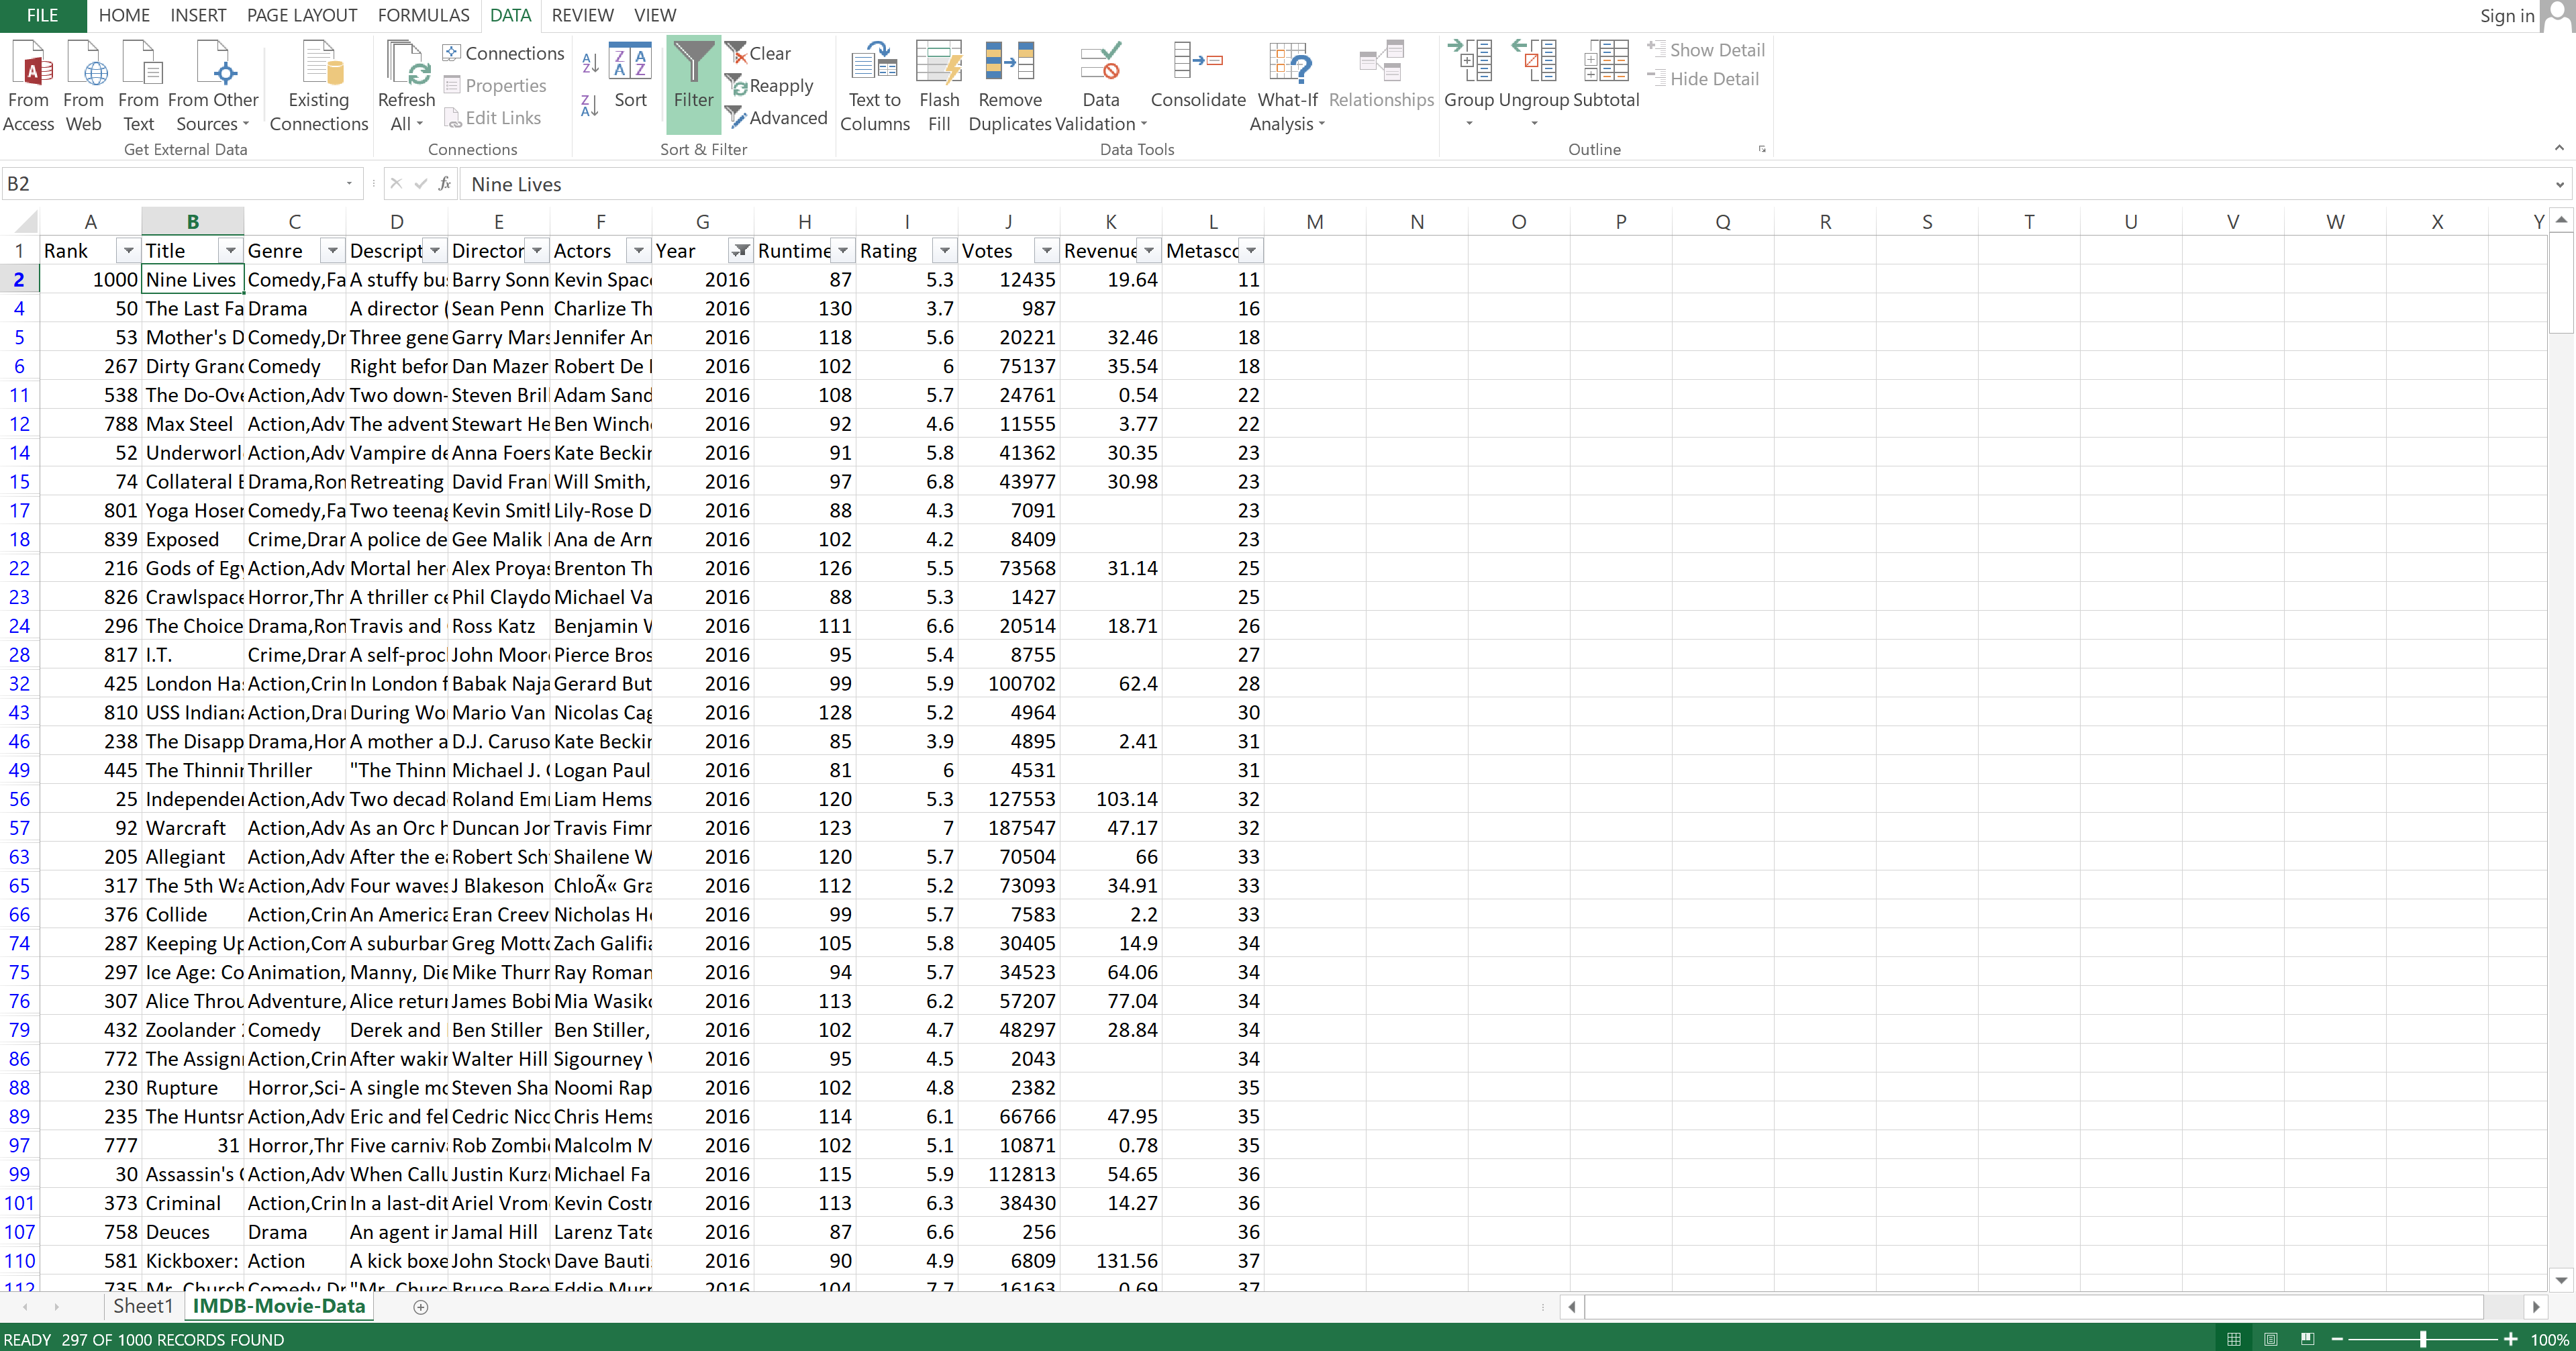
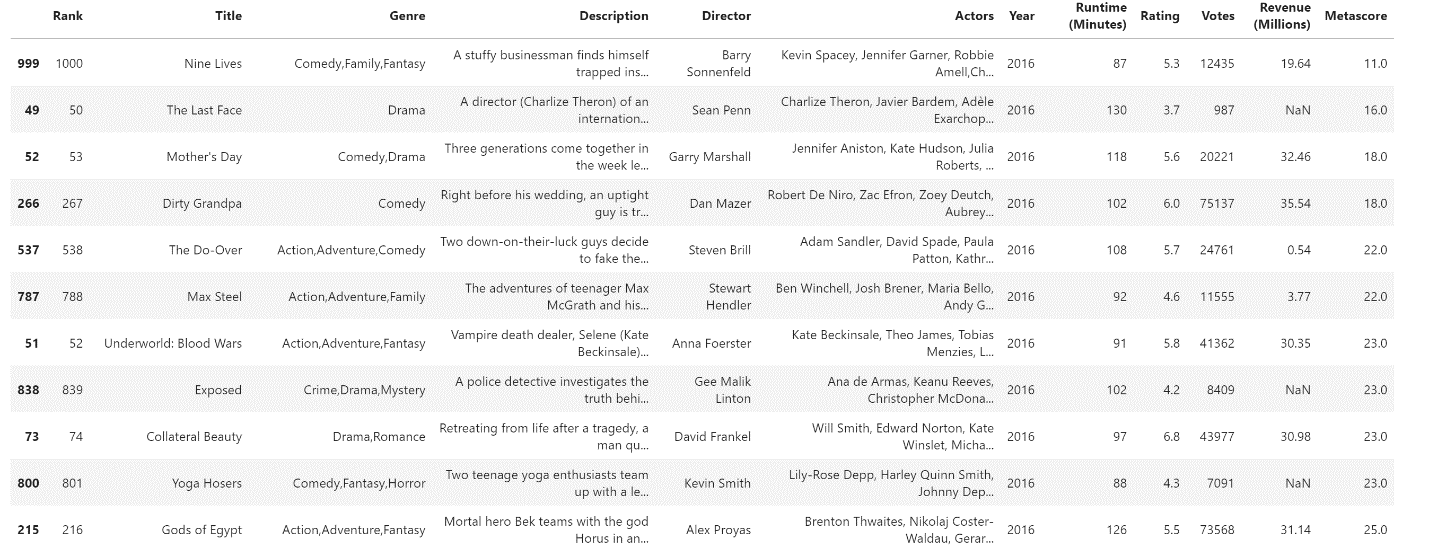
You need to specify that you want to use the movies DataFrame, and that you want to look at only the part of the DataFrame where the value of the Year column is 2016.
Code:
movies[movies["Year"] == 2016]Result:
Image Source: Pandas Imdb-Movies-Data Set, Edlitera
Subtracting Data
Excel
To subtract in Excel, you need to first enter a new column name. Let's call that column Quality_difference.
Image Source: Excel Imdb-Movies-Data Set, Edlitera
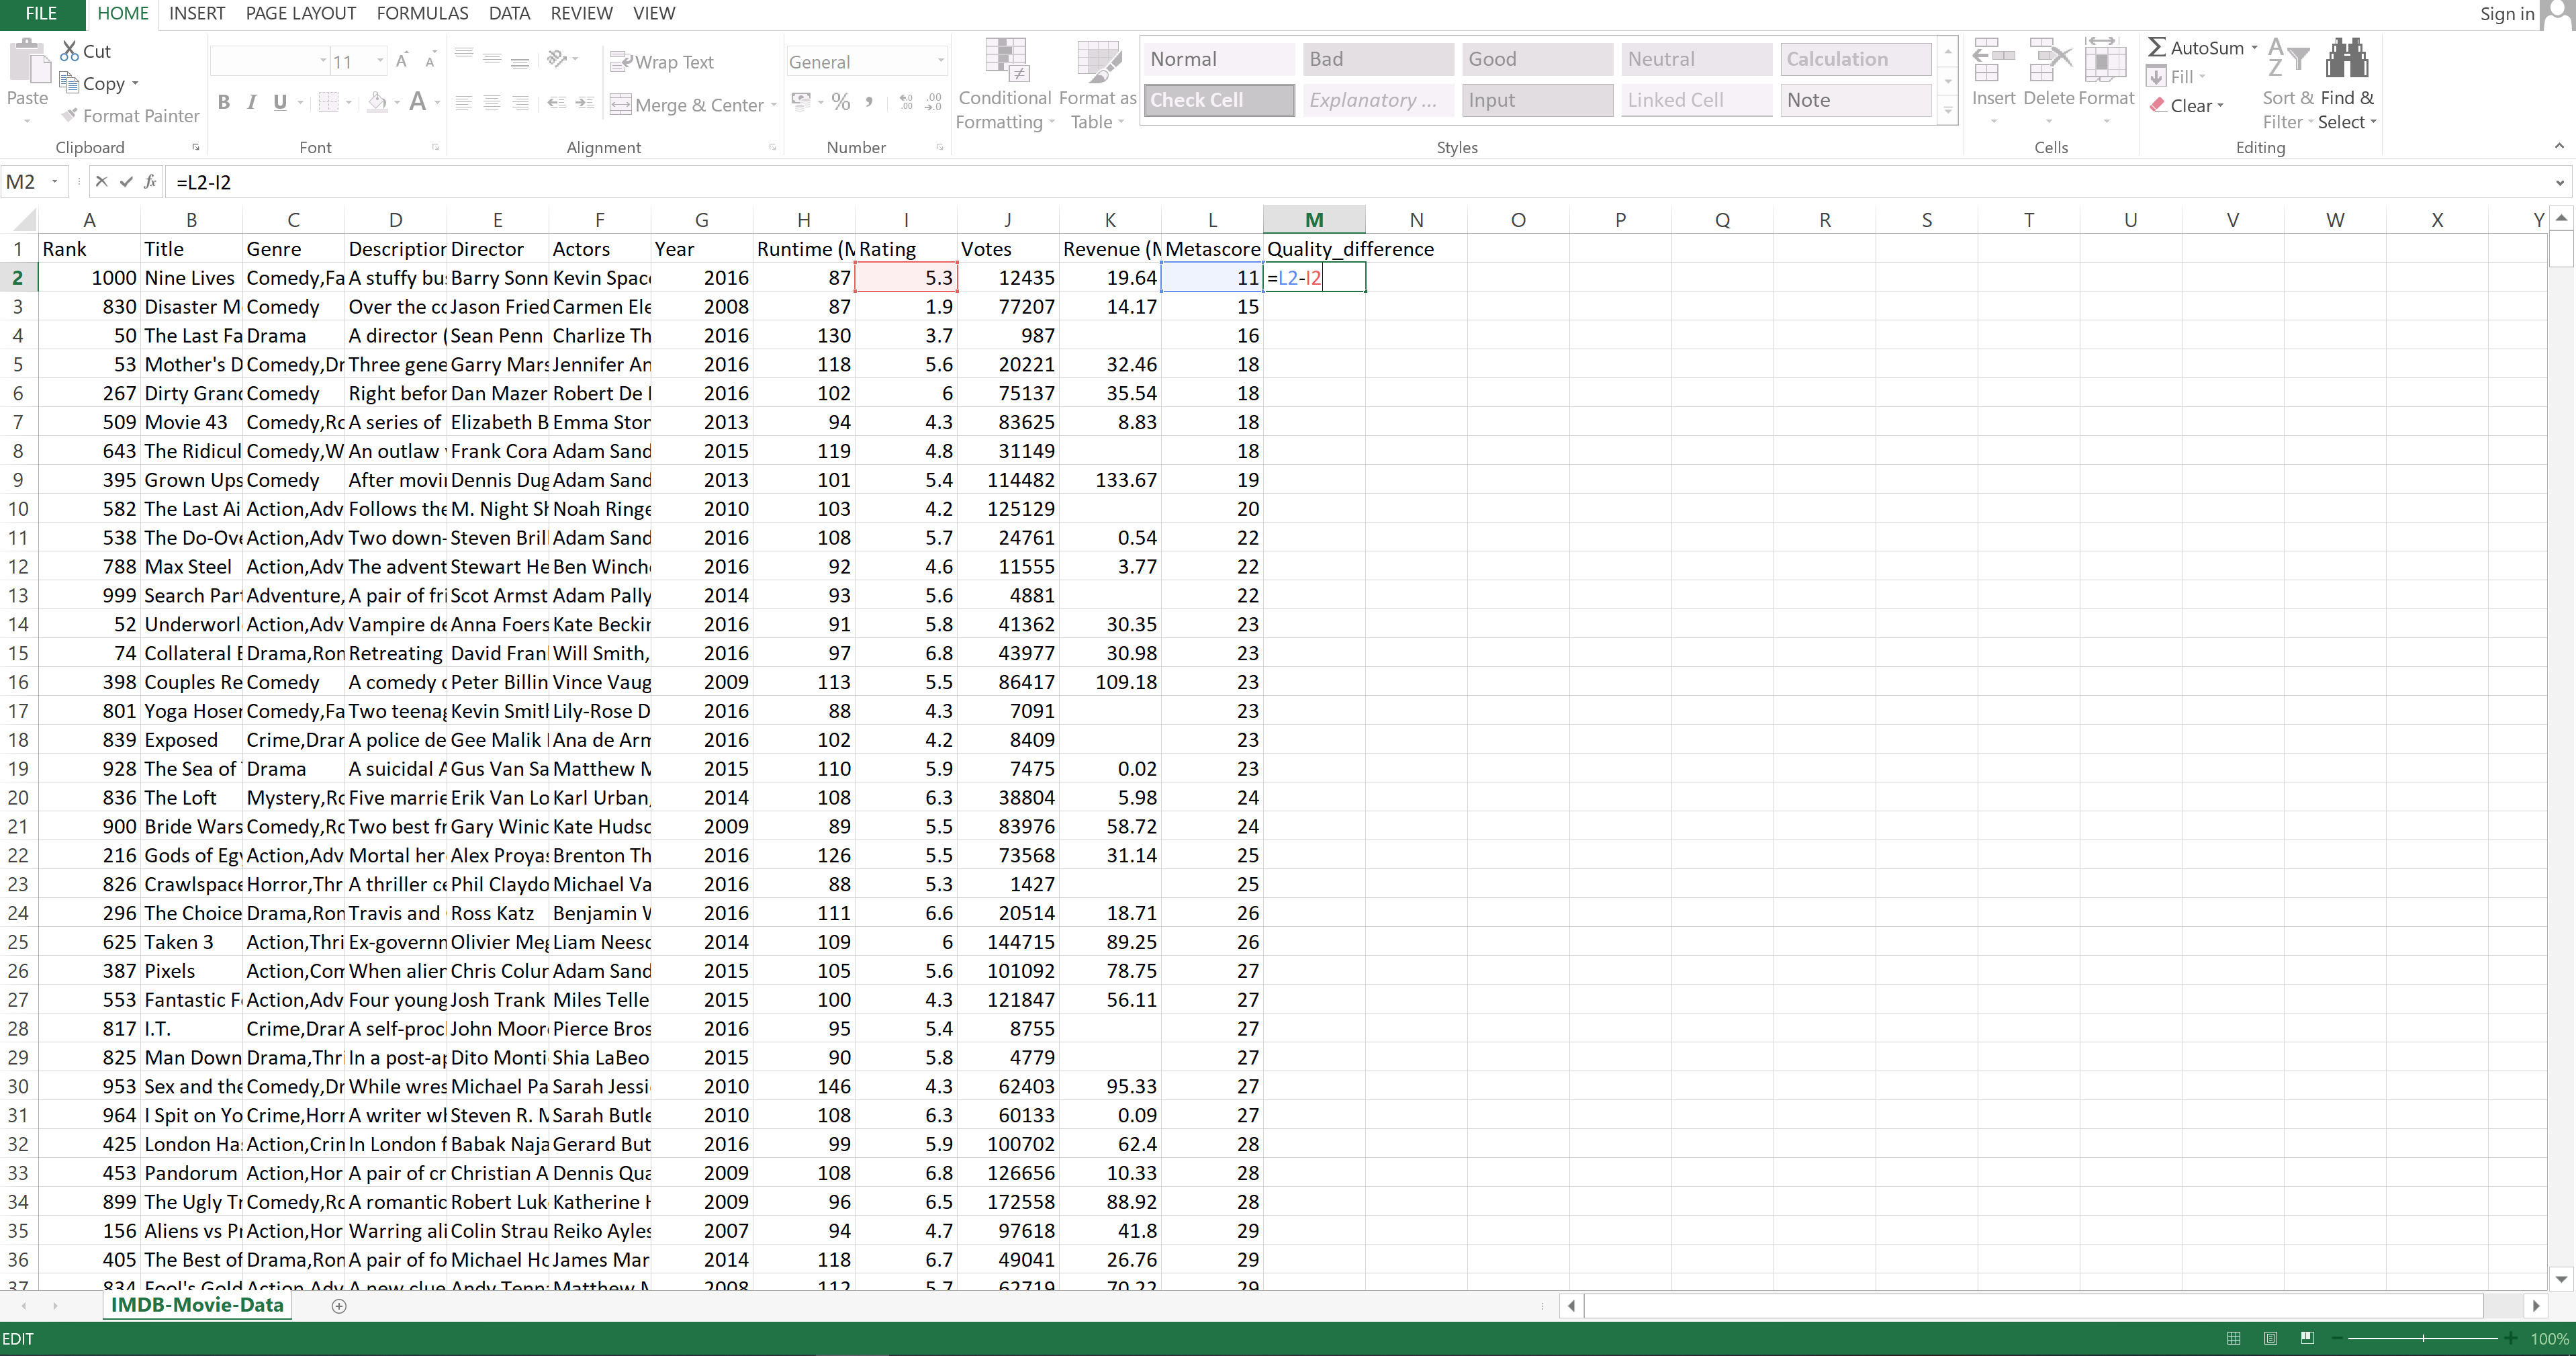
That column is going to hold the values that you get when you subtract the value inside the Rating column from the value inside the Metascore column.
To do that, you need to click on the cell beneath the one holding the column name and enter the formula.
Image Source: Excel Imdb-Movies-Data Set, Edlitera
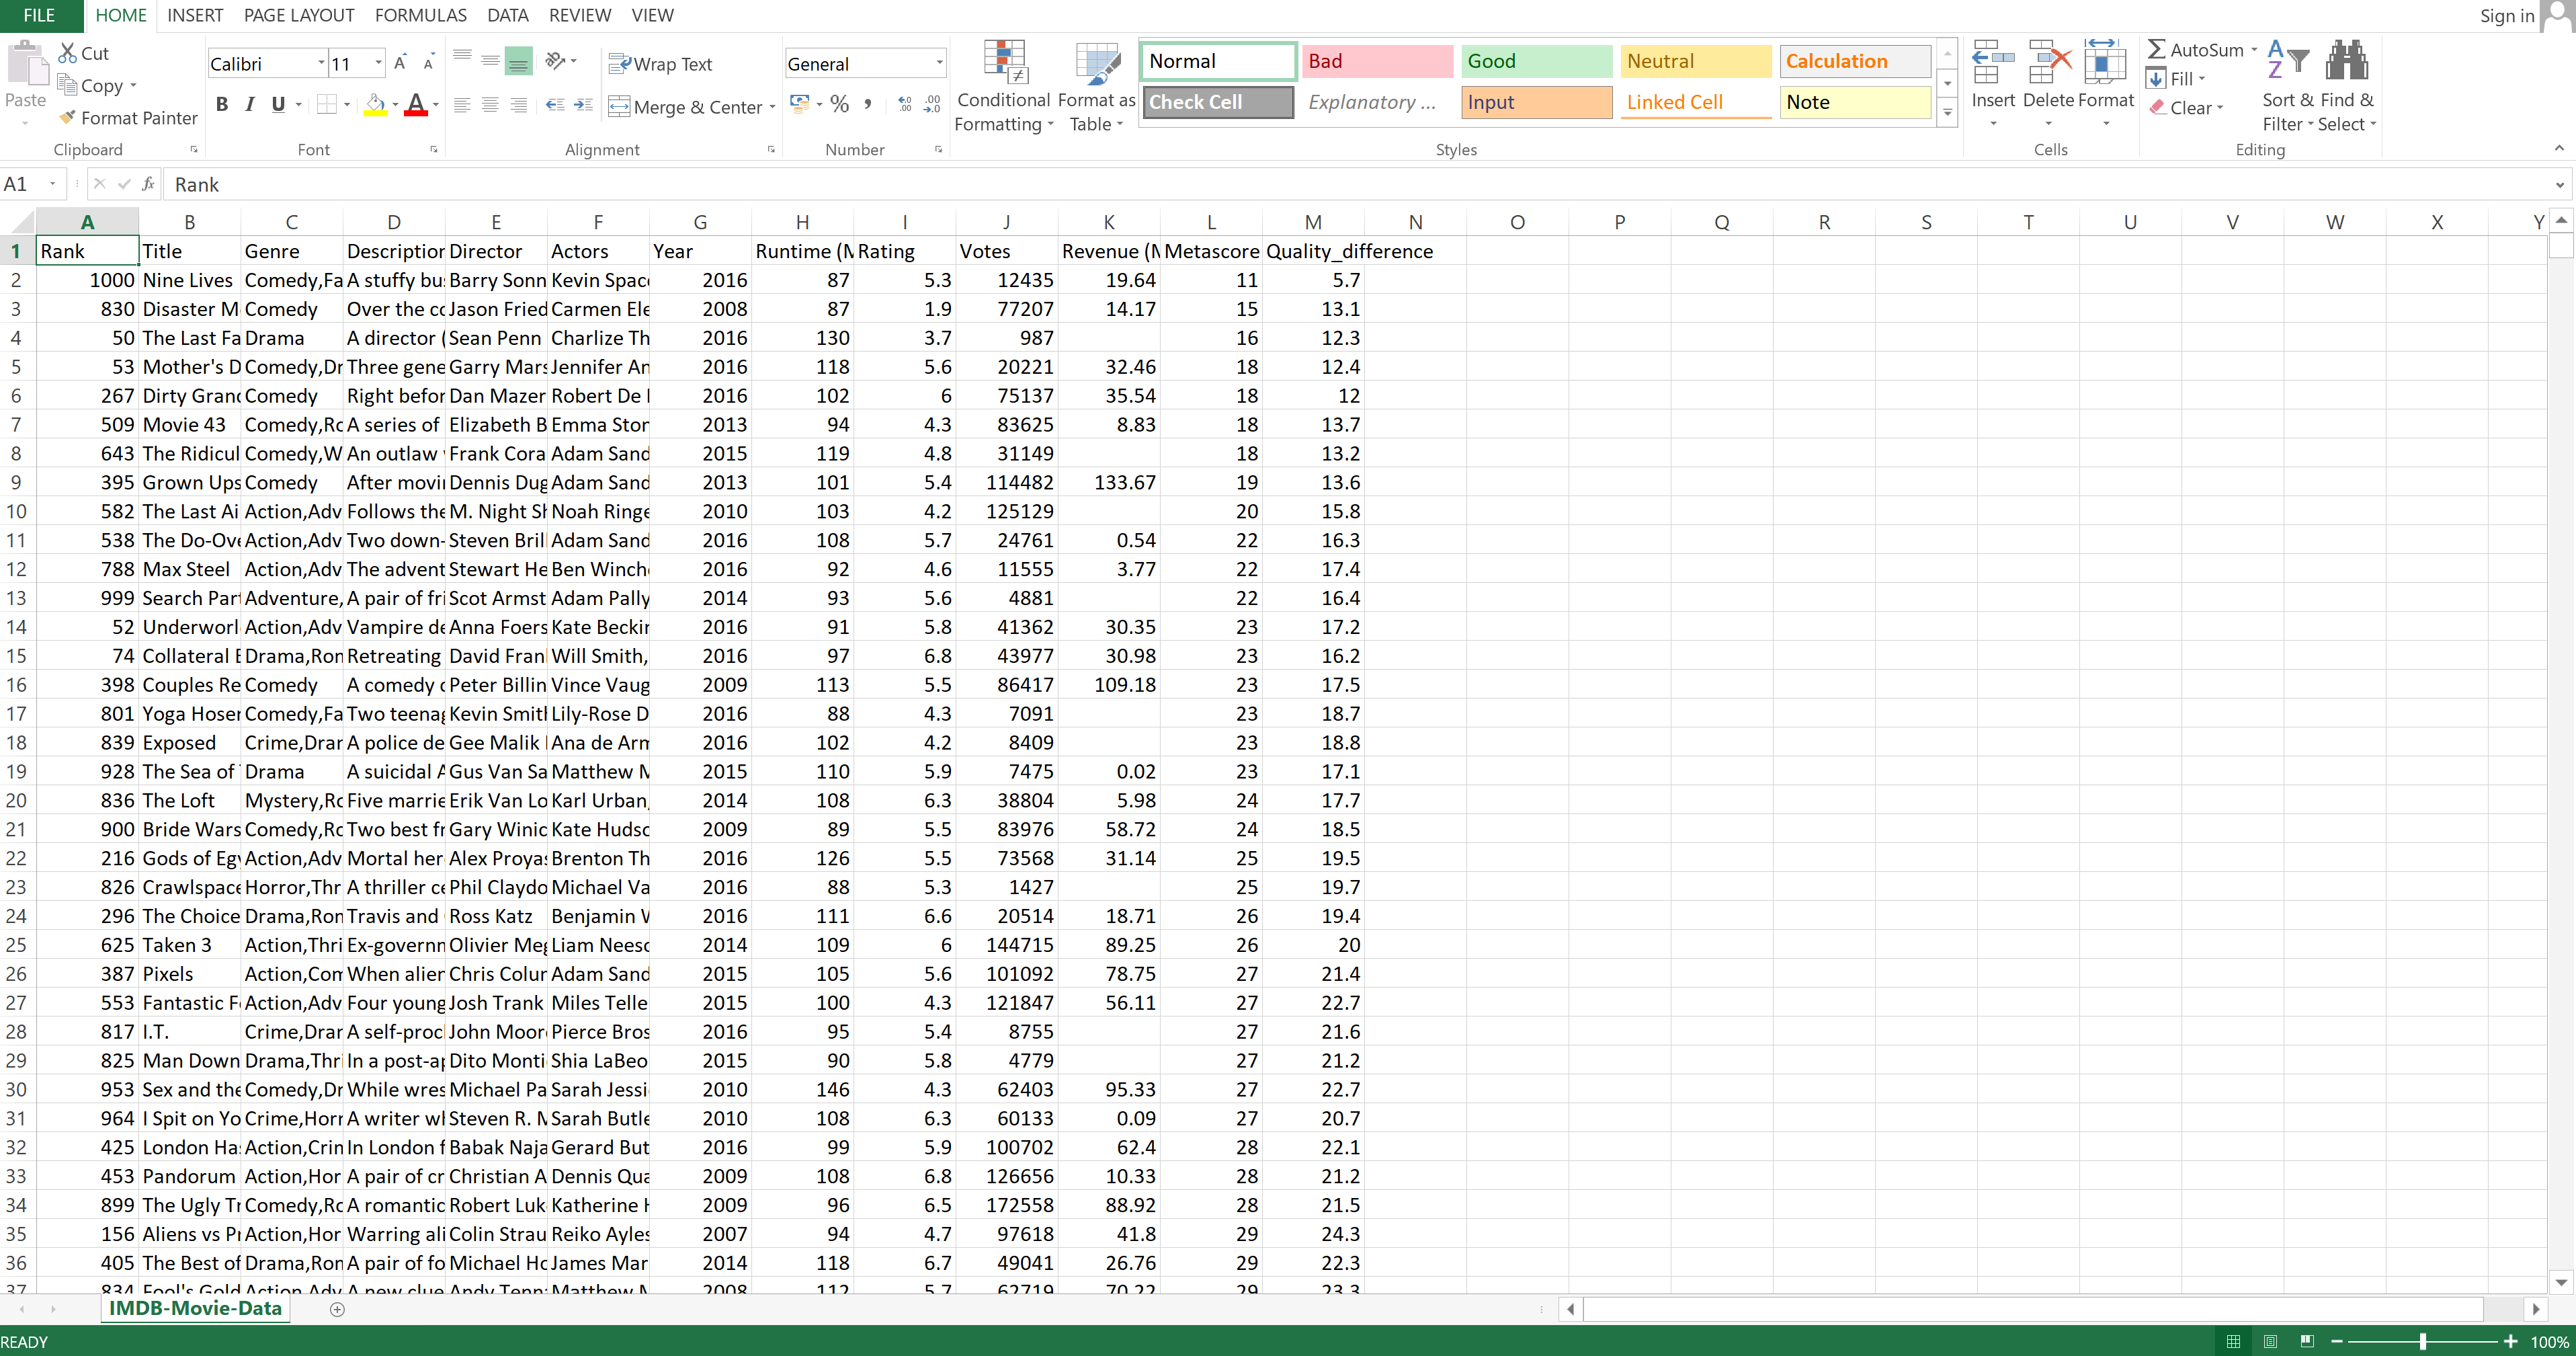
Once the formula has been entered and the value for that field has been calculated, you can double click on the bottom part of that field to propagate the formula through the whole column:
Image Source: Pandas Imdb-Movies-Data Set, Edlitera
Pandas
To achieve the same result in Pandas, you need to write a single line of code. You first specify the name of the new column, and then how to calculate the value that will be inside it.
Code:
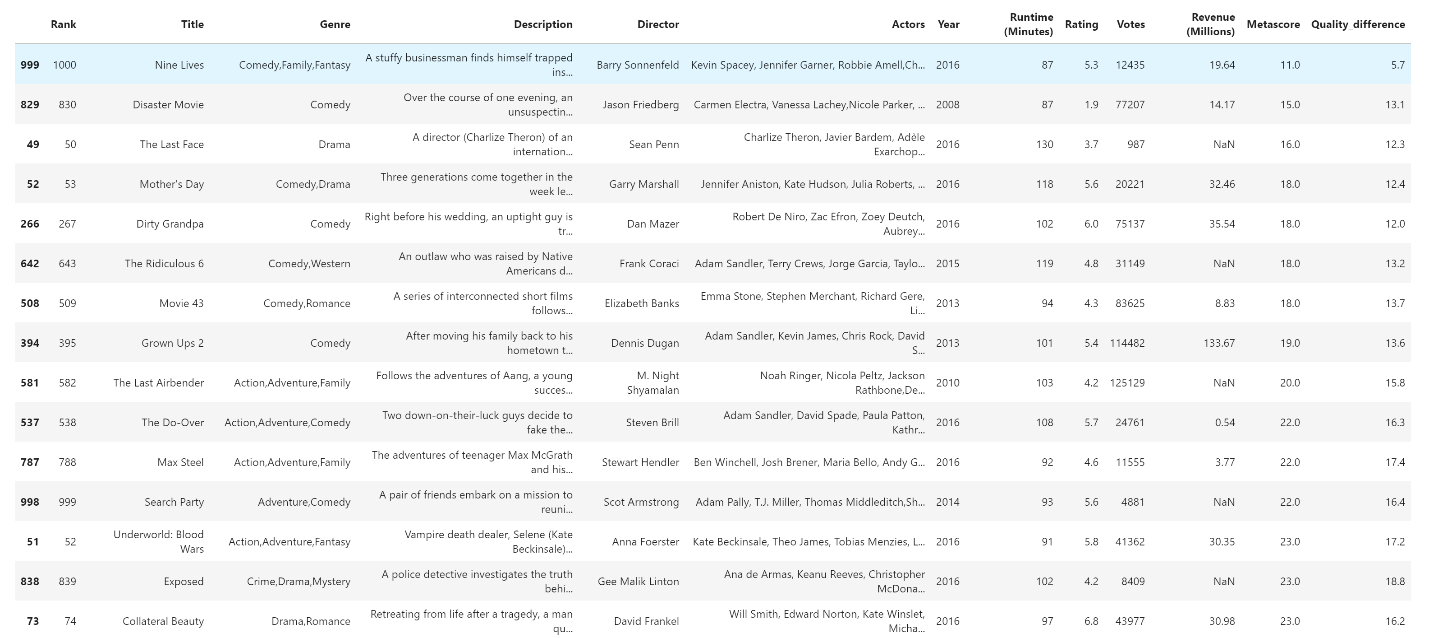
movies["Quality_difference"] = movies["Metascore"] - movies["Rating"]Result:
Image Source: Pandas Imdb-Movies-Data Set, Edlitera
You achieve the same result as with Excel, but with a lot less work.
Merging Datasets
Excel
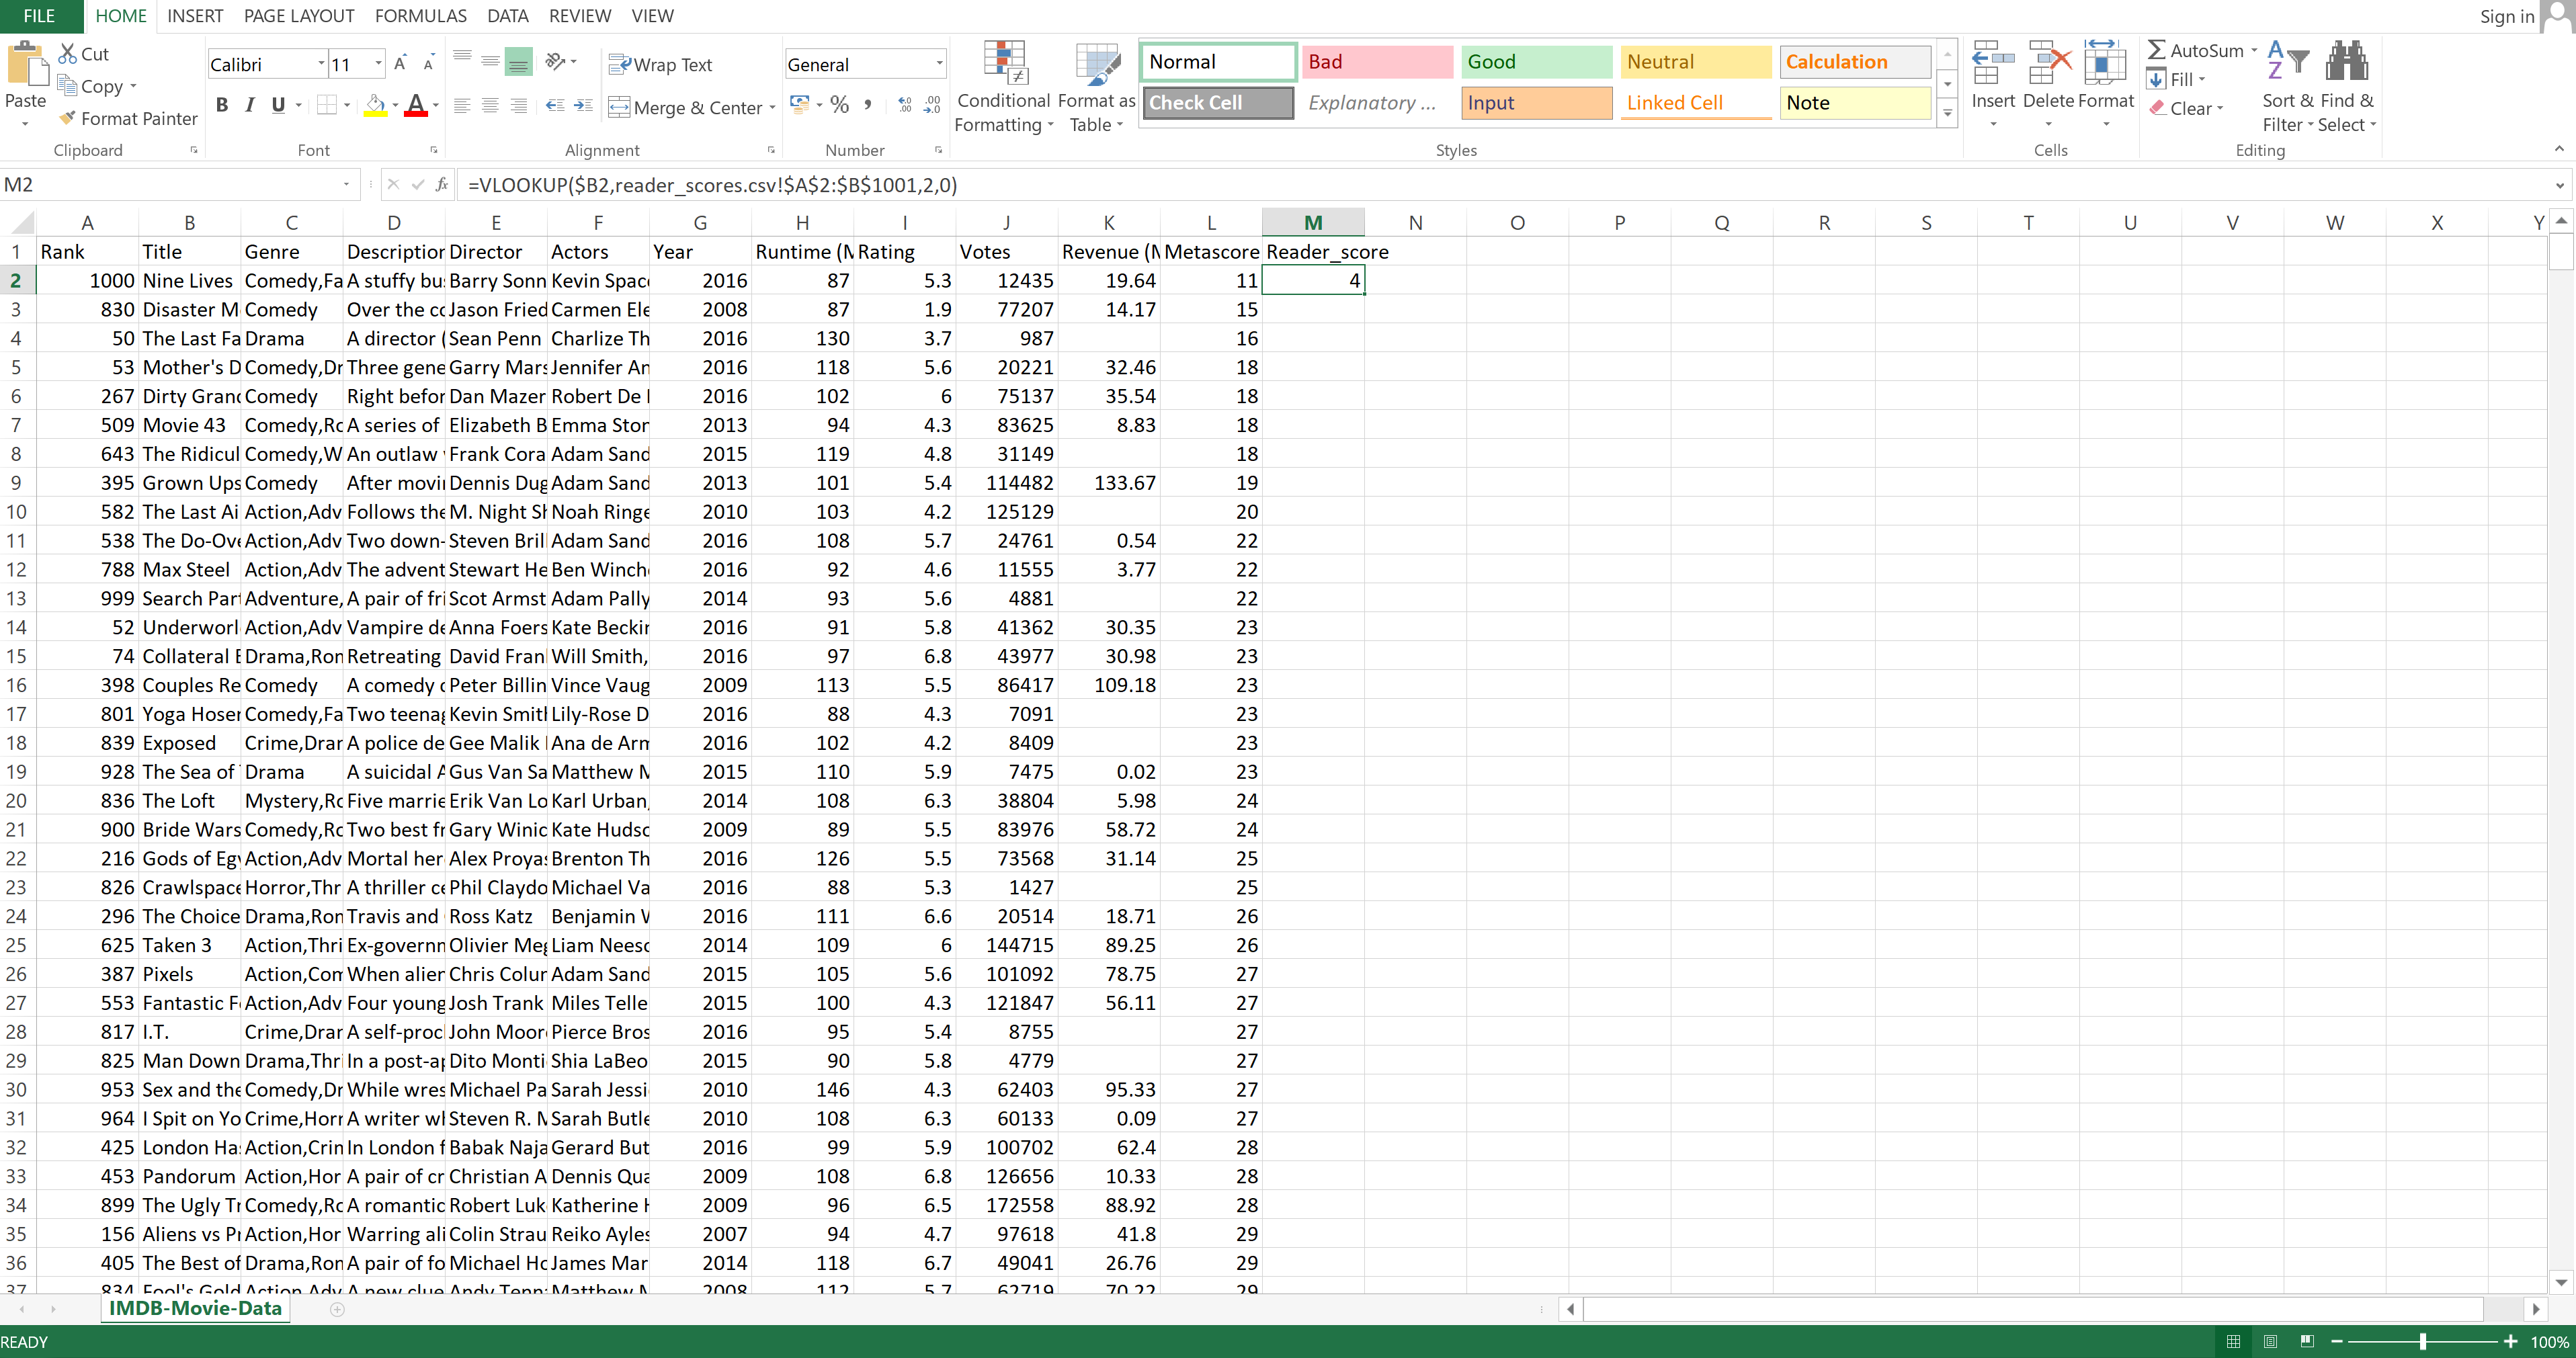
If you have two spreadsheets and want to merge them using some columns they have in common, you use VLOOKUP(). Let's merge the original table with one that holds the Title and Reader_score columns.
To connect the second table to the original one based on the Title columns (since they both have it), you will first create a column named Reader_score in the first spreadsheet. This is the name of the column that will be added when you merge the first table with the second one:
Image Source: Excel Imdb-Movies-Data Set, Edlitera
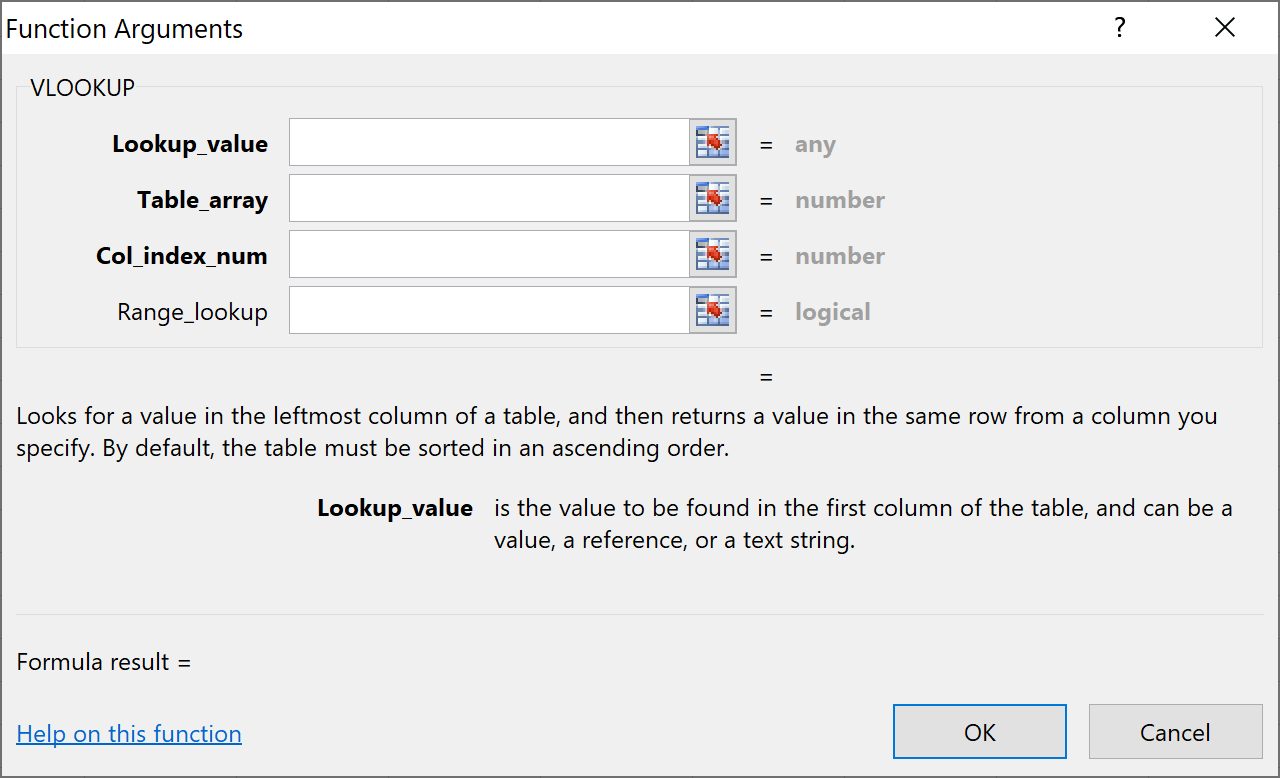
After you have created the column, you need to merge the tables based on the Title column. To do that, you will click into the first empty cell of the column you just created in the original table and start writing the VLOOKUP() code.
After writing
=LOOKUP(
click CTRL+A and it will take you to a screen that looks like this:
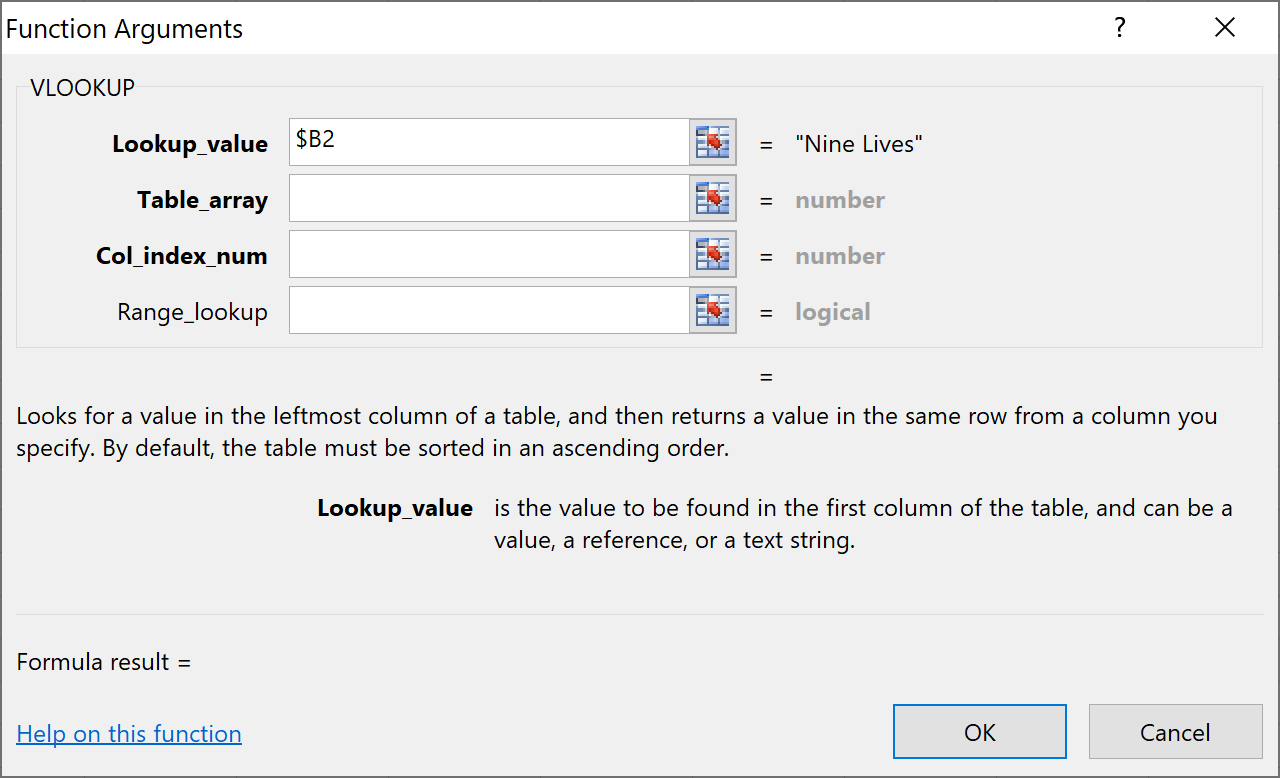
In the Lookup_value field, you need to enter the first row of the Title column, which is B2. Since you will also propagate that code through the whole column later, you will freeze this value so the result looks like this:
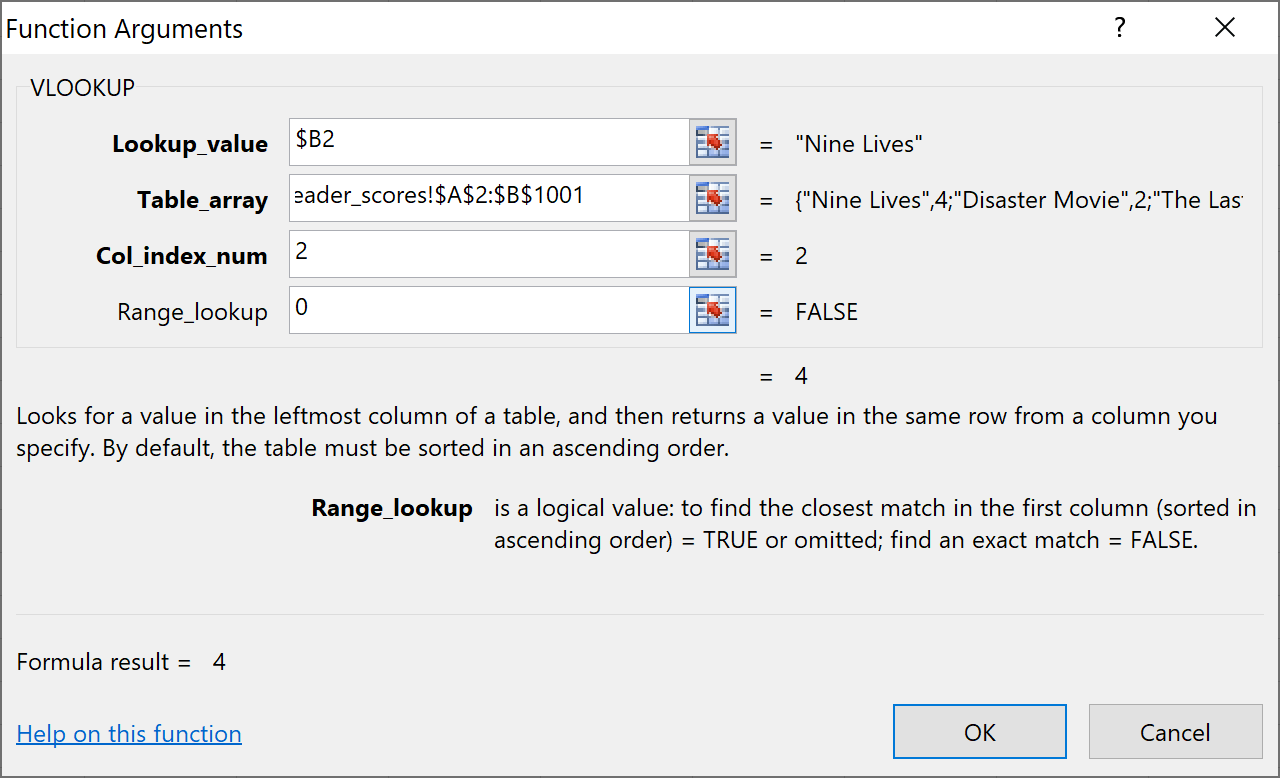
Afterward, in the Table_array field, you need to input the whole second table you have, starting with A1 and finishing with B1001. When you do that, you will also freeze these values to make sure you can propagate the formula through the whole column.
The result looks like this:
Next, you need to add a value to the Col_index_num field. You will enter the number two because that is the number of the column that you want to merge with the first spreadsheet:
To finish, you will set Range_lookup to 0. This will signal to the program that you are searching for exact matches.
The result you should get from this is:
Image Source: Excel Imdb-Movies-Data Set, Edlitera
To copy the formula, you can just double-click on the bottom part of the first row.
Image Source: Pandas Imdb-Movies-Data Set, Edlitera
Pandas
It is very easy to merge datasets using Pandas. You can perform the whole procedure with two lines of code, using the merge function. The first line loads the second dataset into a second DataFrame, and the next line performs the merging procedure.
When merging, you specify:
- The first dataset for the merge
- The second dataset for the merge
- How you want to merge your data
- The column they have in common
Code:
reader_scores = pd.read_csv("reader_scores.csv")
movies = pd.merge(movies, reader_scores, how="left", on="Title")Result:
Image Source: Pandas Imdb-Movies-Data Set, Edlitera
The merging procedure in Pandas is very flexible. Aside from performing merges like this, you can also modify the merging procedure by modifying the how variable inside the code. You can use left merges, right merges, inner merges, and outer merges by changing only one variable.
Pivoting Tables
Excel
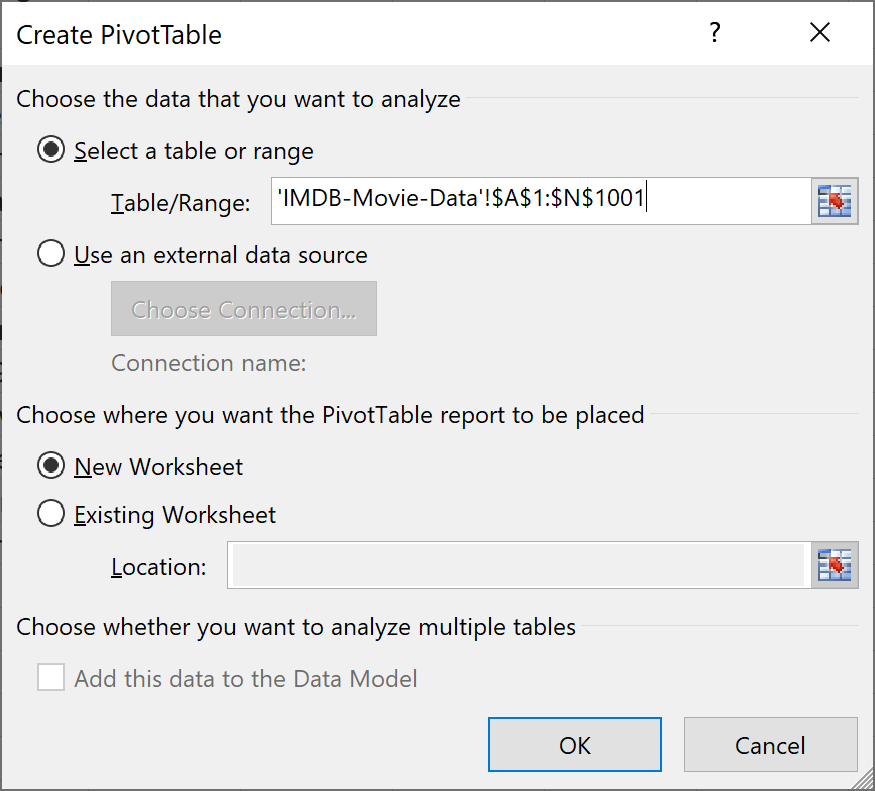
To pivot a table in Excel, the first thing you need to do is go to the Insert tab and then click on PivotTable.
Let's select your current table and select that you want to create a new worksheet. Follow that up by clicking on OK:
Your screen will change to look like this:
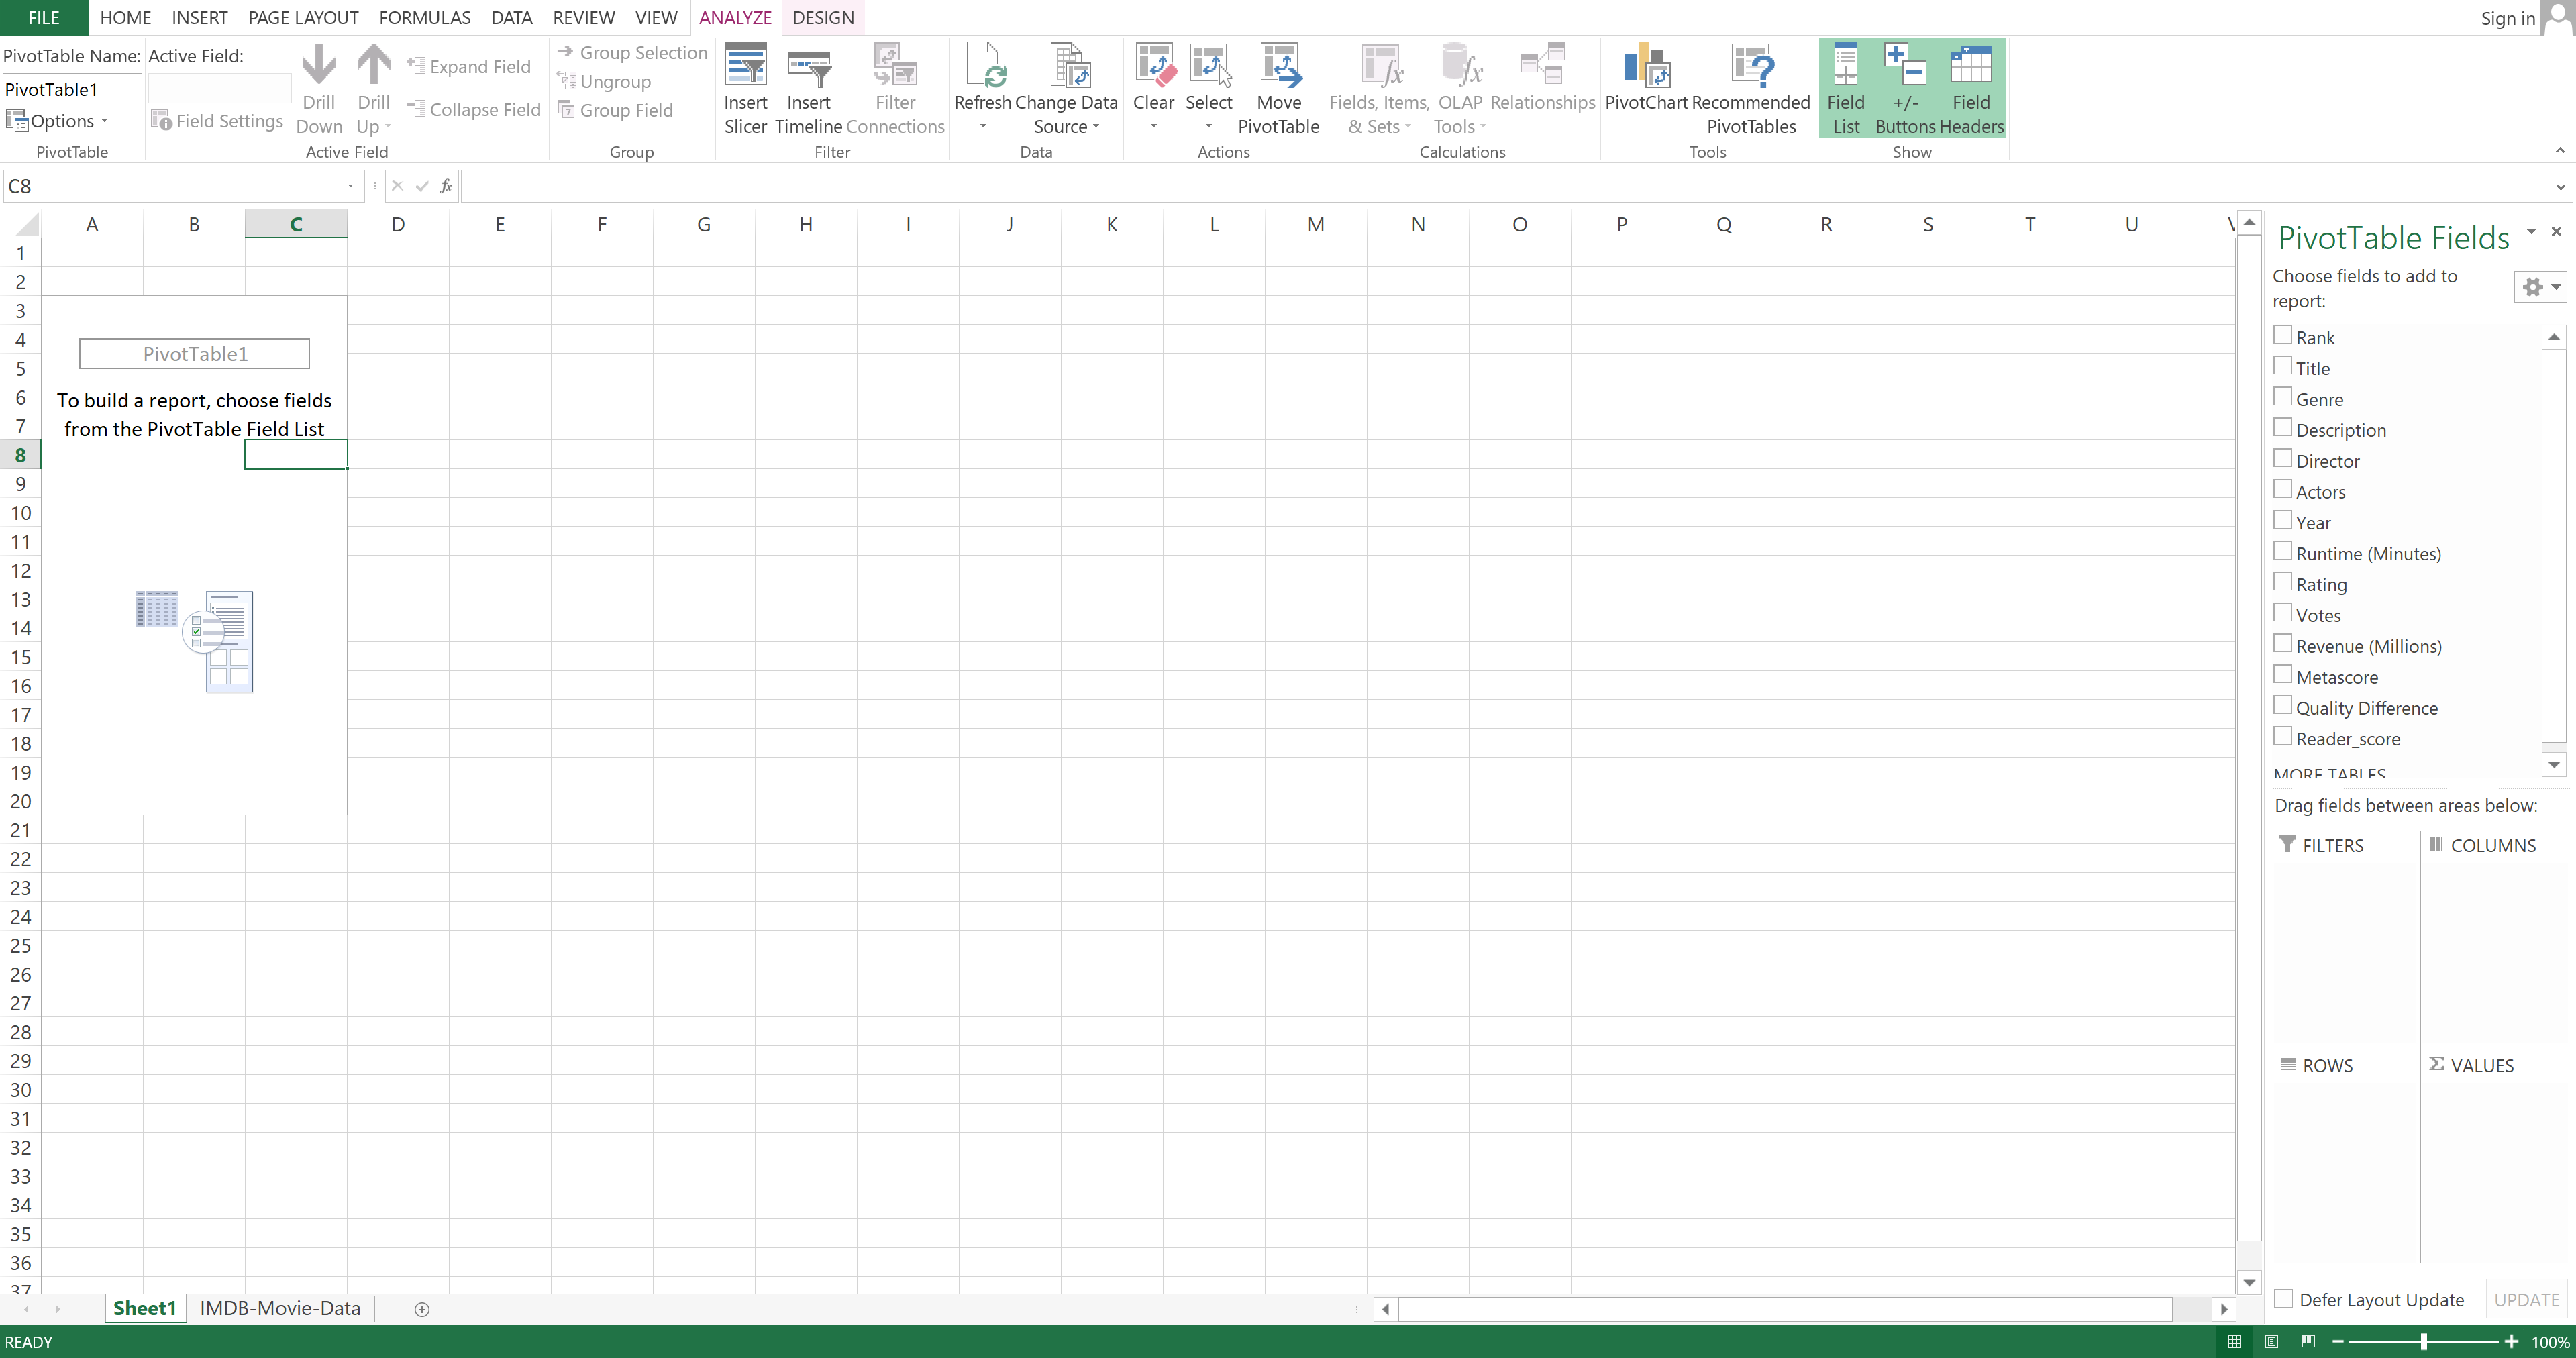
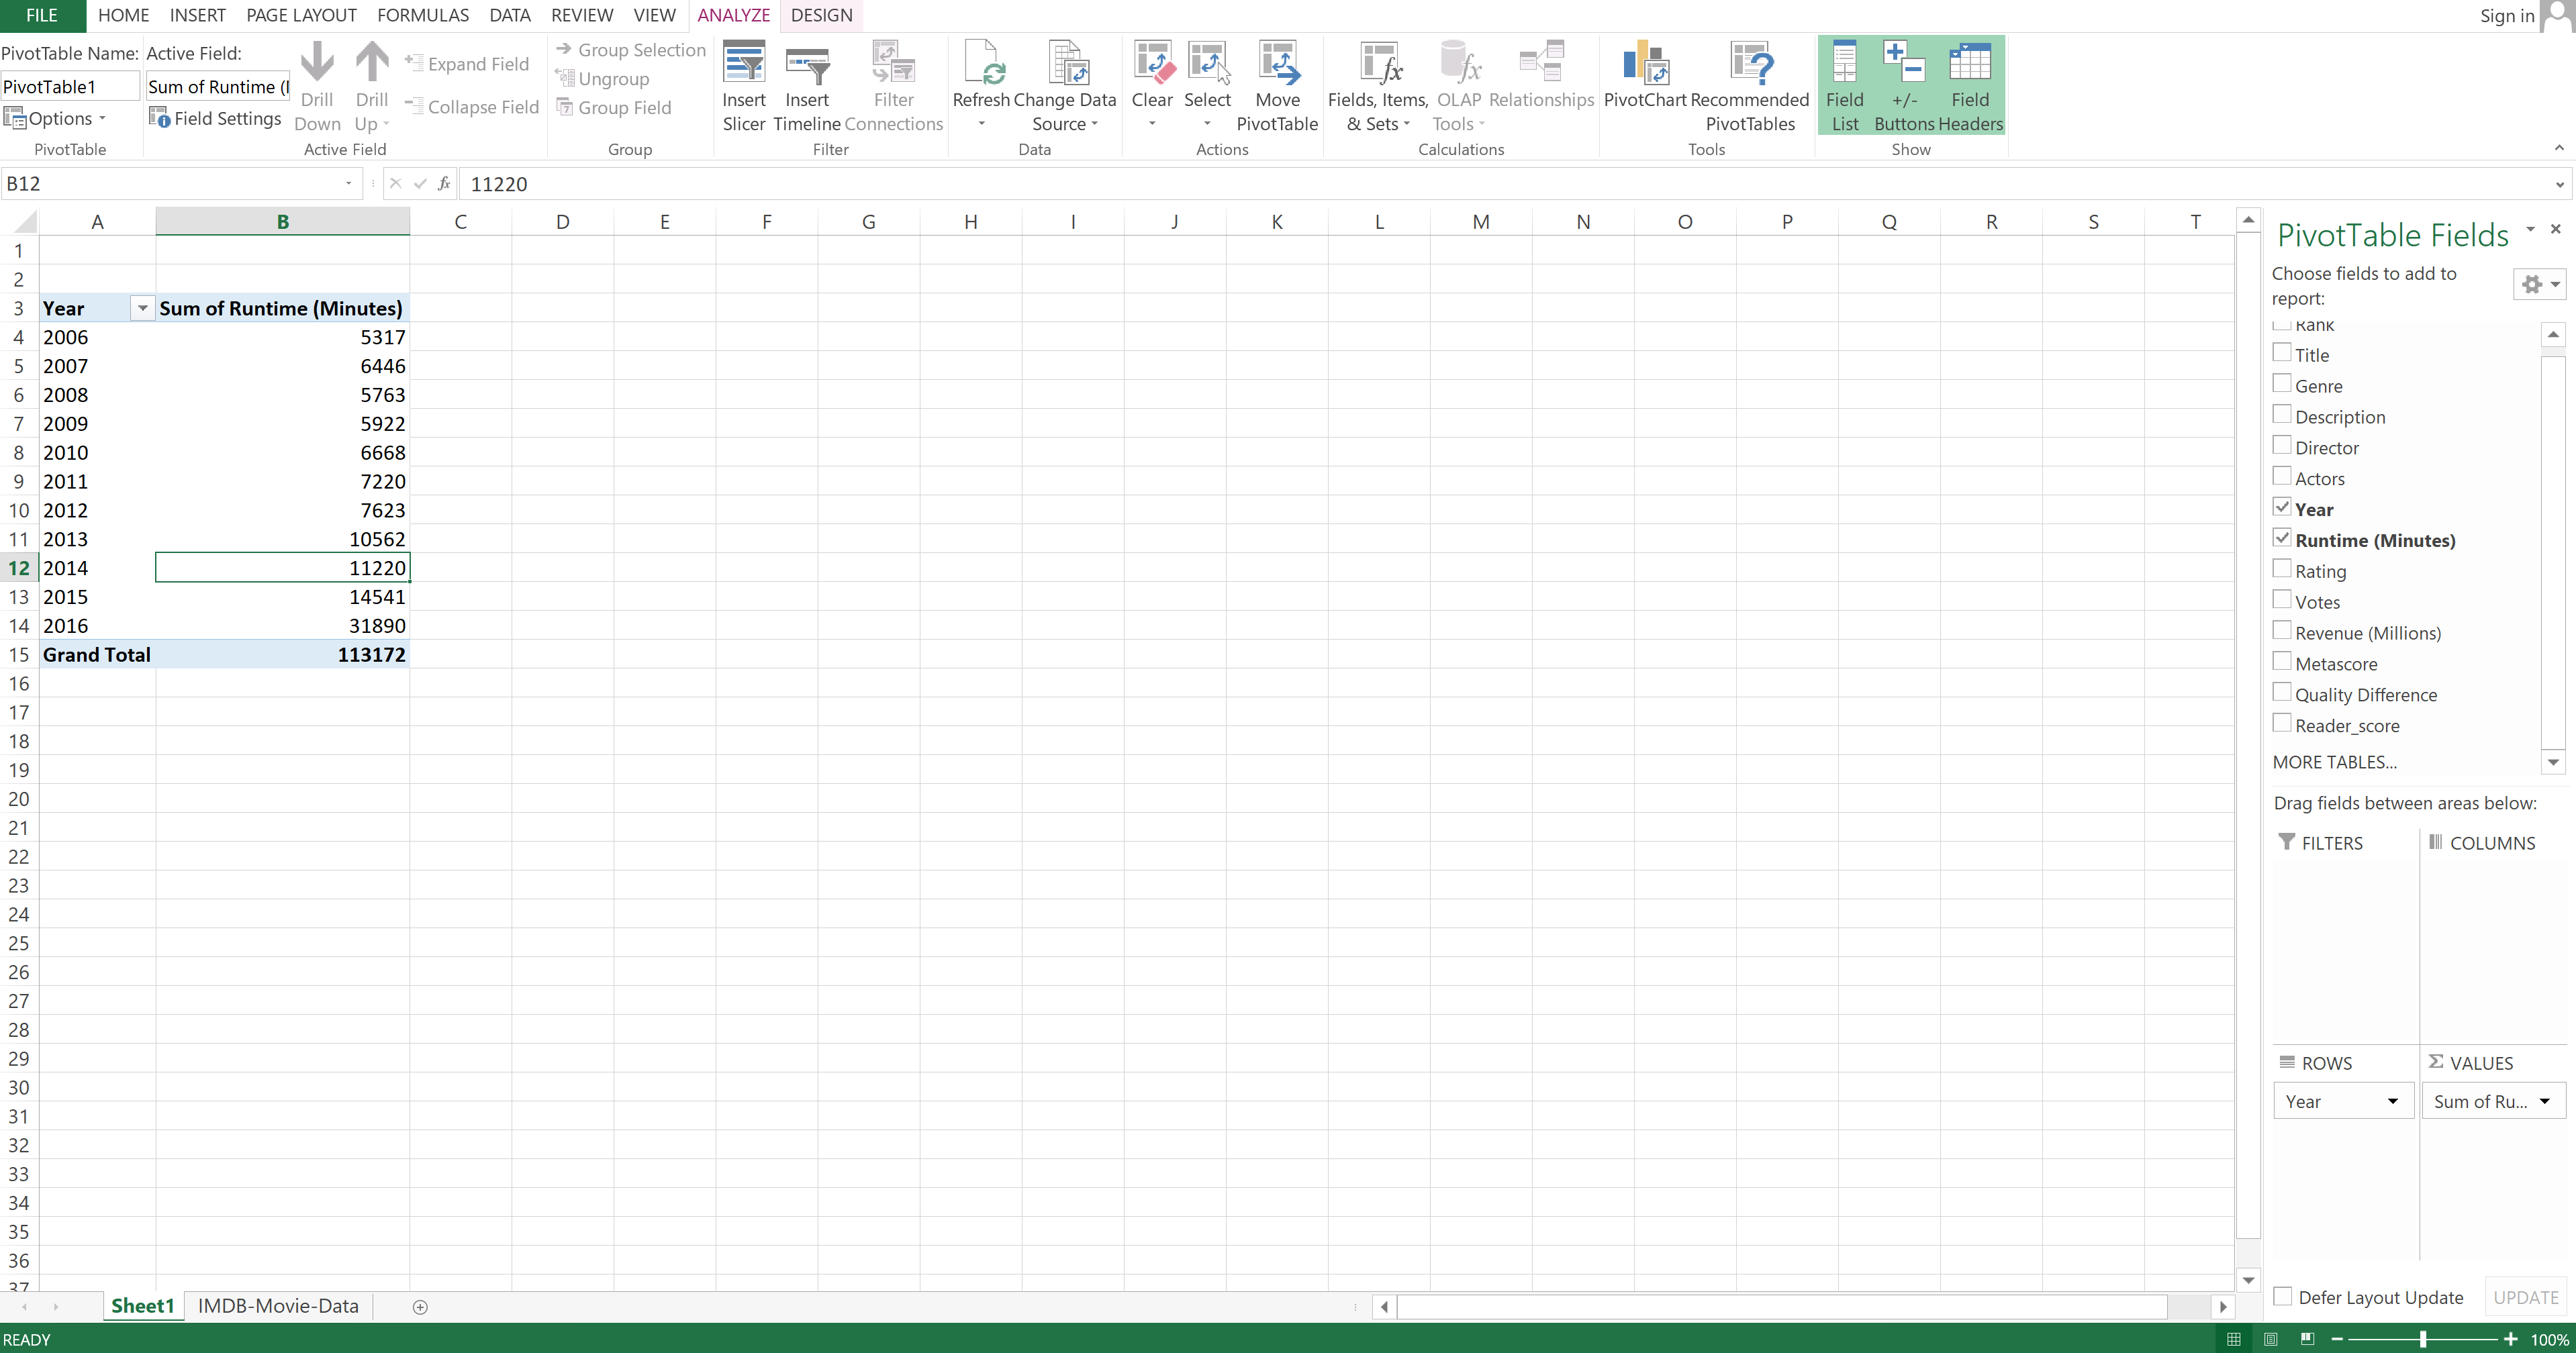
In the right panel, you need to select that you want to look at the Year and Runtime (Minutes) columns. You also need to select Year under Rows and Runtime (Minutes) under Values.
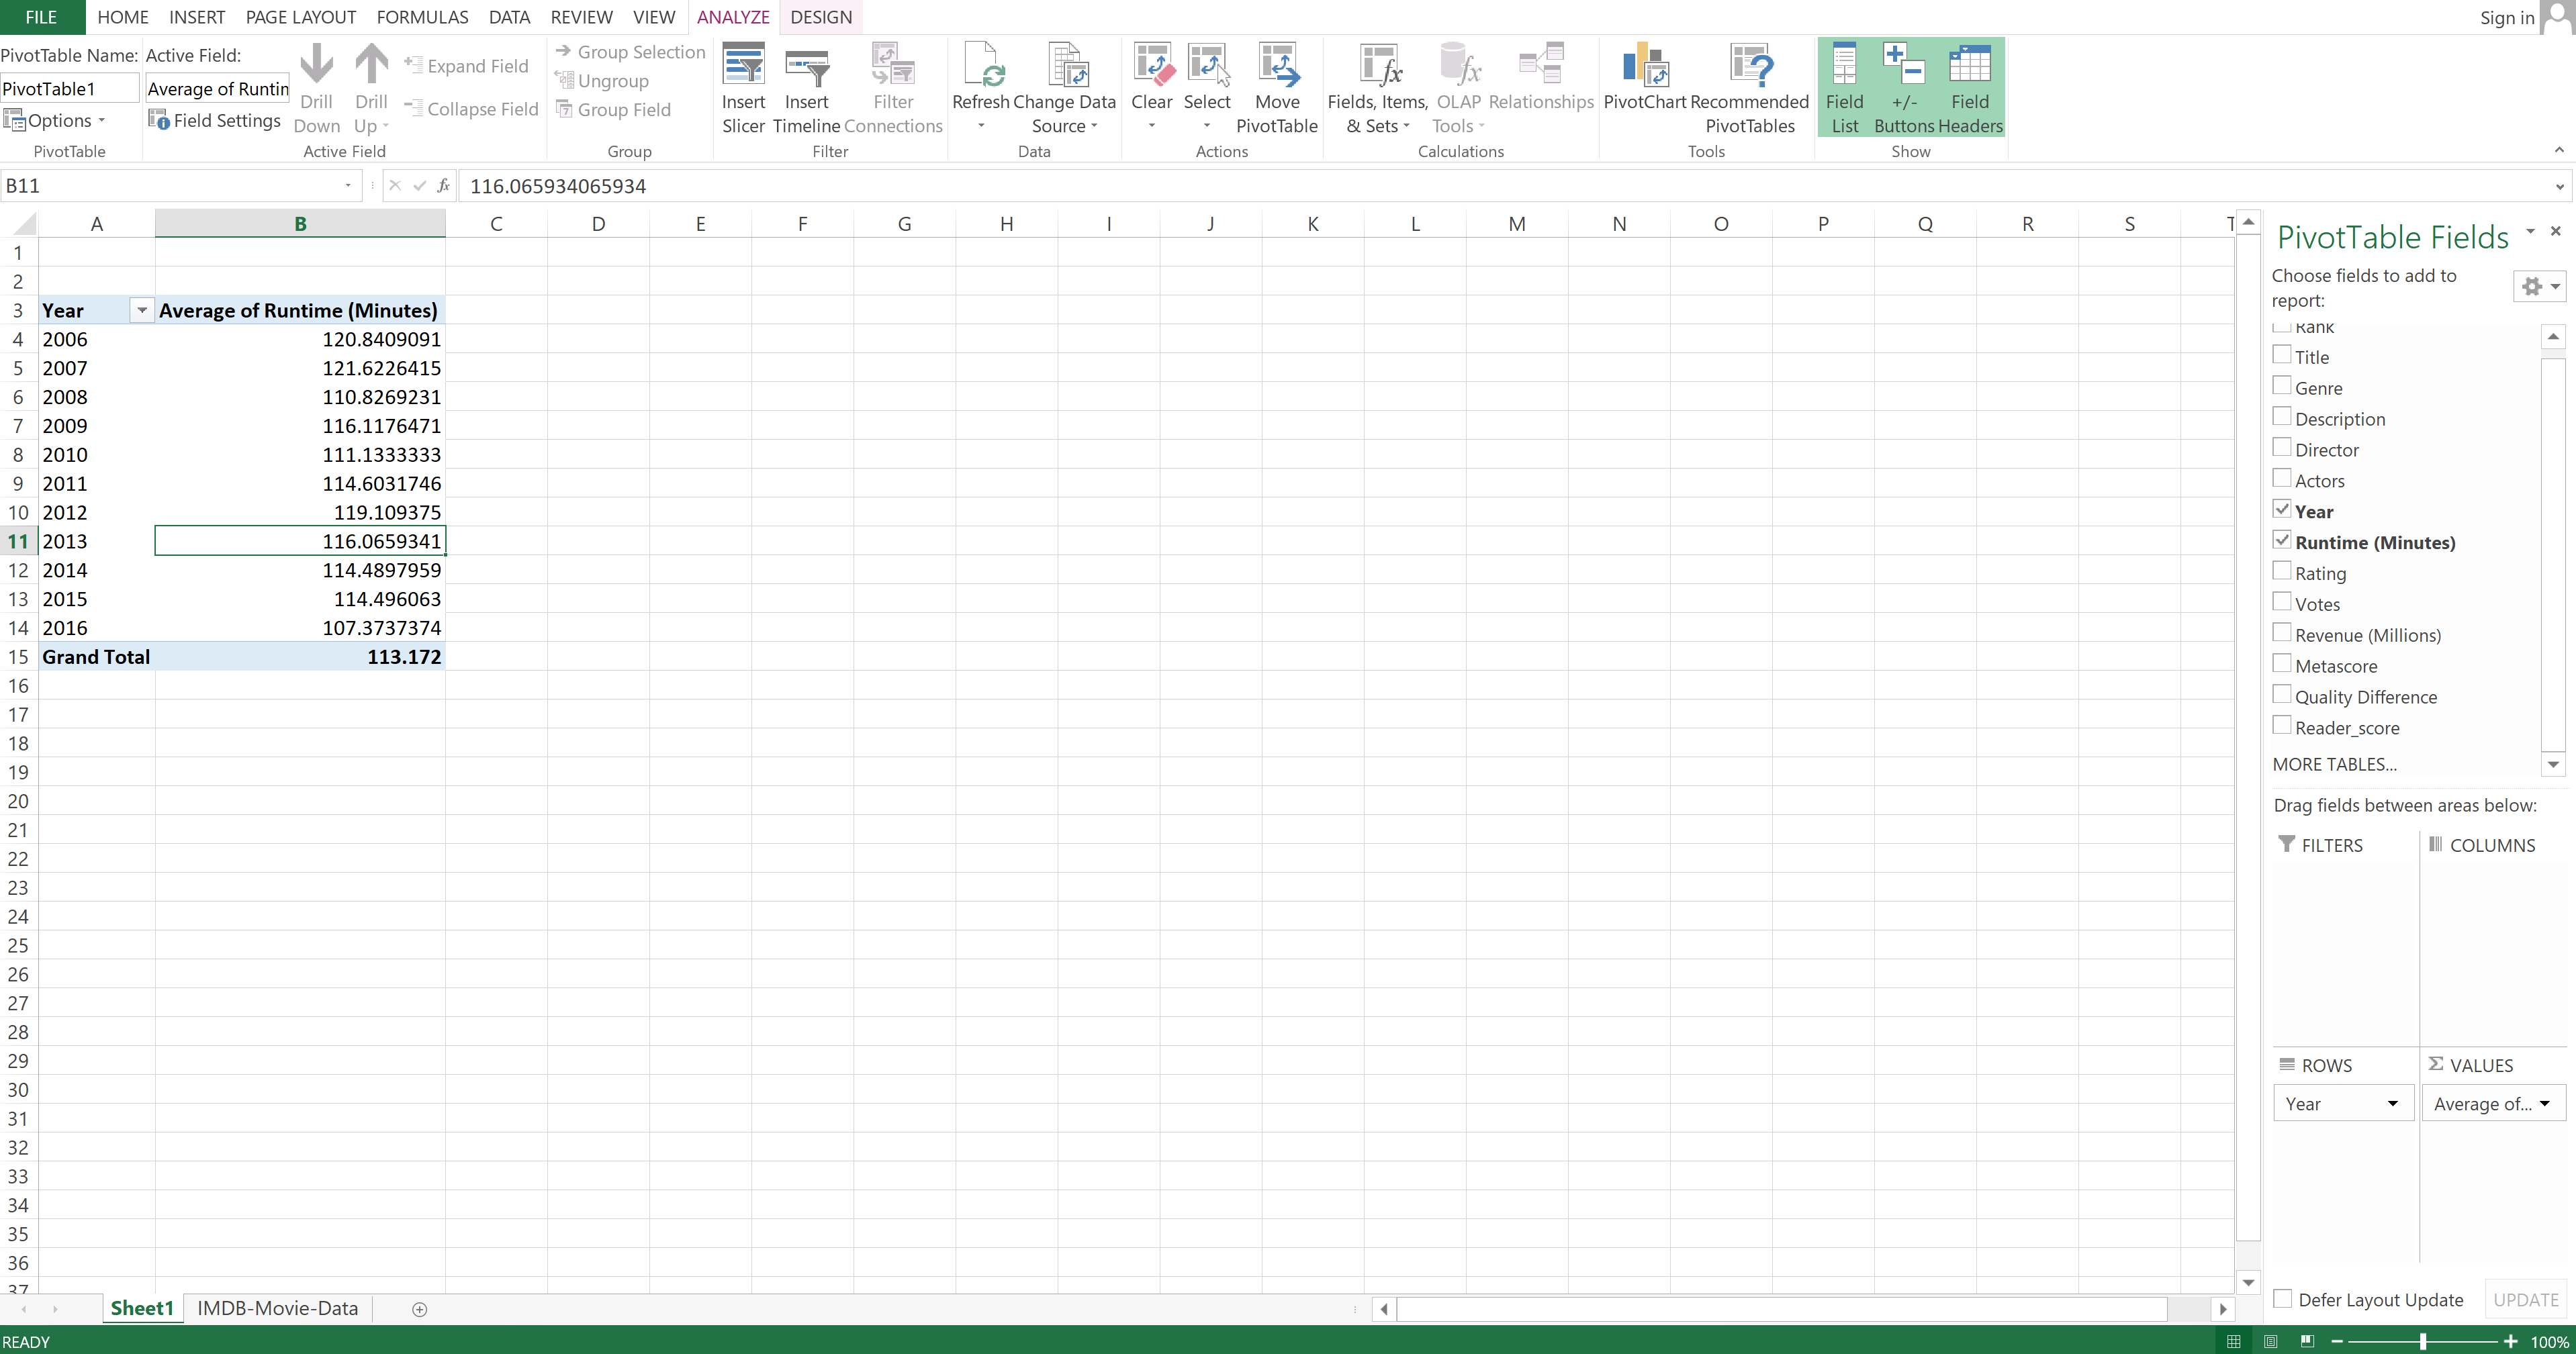
The resulting table will look like this:
Image Source: Excel Imdb-Movies-Data Set, Edlitera
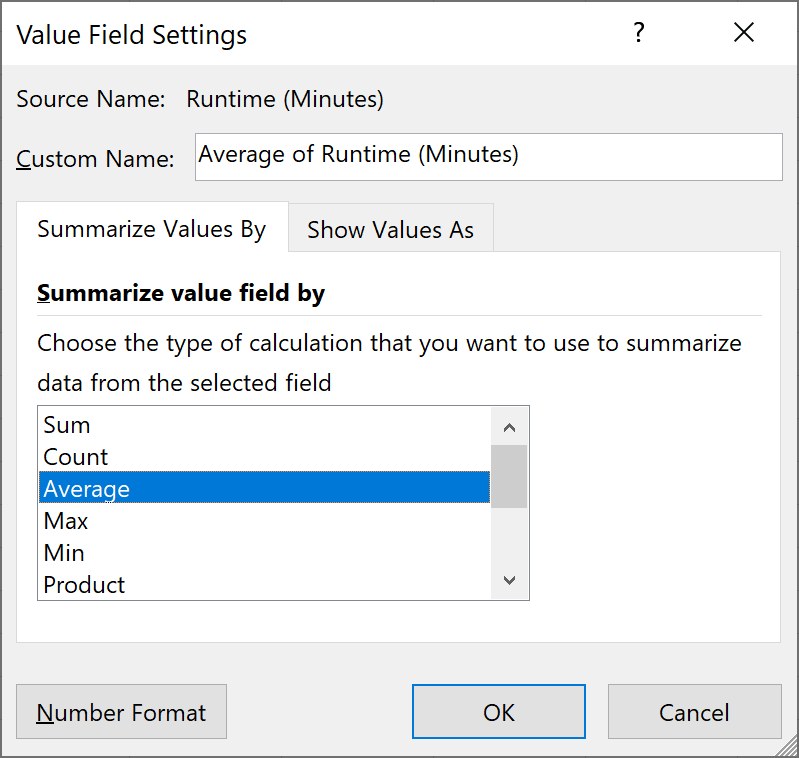
By default, it will sum up the values in the Runtime (Minutes) column. Since you want to find out the average length of a movie for each year, you need to click under Values on the bottom right and then select Value Field Settings.

Once inside the panel, you can select that you want to show the average values:
The final result is:
Image Source: Excel Imdb-Movies-Data Set, Edlitera
Pandas
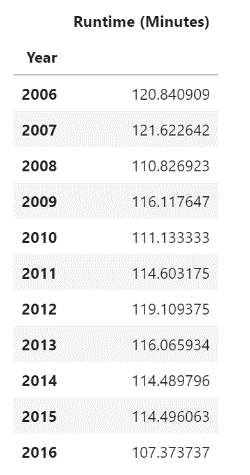
To pivot data, use the Pandas pivot_table function. You need a single, although a bit longer, line of code to create pivot tables in Pandas.
You need to specify:
- A name for your new table that will be created by pivoting
- The dataset that you want to pivot by defining it in the data variable
- The column that will be your index by defining it in the index variable
- The column that you want to analyze by defining it in the values variable
- That you want to use the mean function by defining it in the aggfunc variable
Let's separate that one line into multiple lines to match the steps above.
Code:
table = pd.pivot_table(
 data=movies,
 index="Year",
 values="Runtime (Minutes)",
aggfunc= "mean")Result:
What Can Advanced Pandas Do?
To finish, let's demonstrate the true power of Pandas by showing just how much you can achieve with very little code. I will show off two different methods that give you a lot of information and require only one line of code.
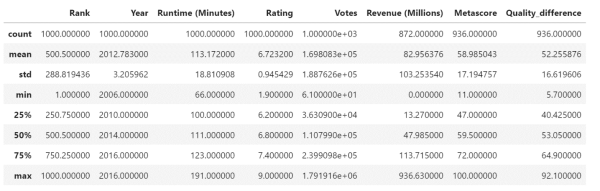
DataFrame.describe()A very useful Pandas method is the describe() method. You use it for descriptive statistics on all variables in your dataset. By default, it analyzes only numeric data, but you can modify it to also analyze non-numeric data.
For numeric data, the result’s index will include:
- Count - describes the number of data points inside a column
- Mean - mean value
- Std - standard deviation
- Min - the smallest value
- 25% - 25th percentile values
- 50% - 50th percentile value
- 75% - 75th percentile value
- Max - the biggest value
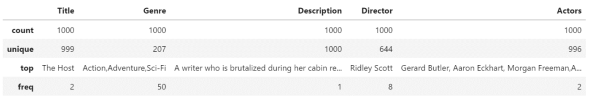
For non-numeric data, the result’s index will include:
- Count - describes the number of data points inside that column
- Unique - shows the number of unique values
- Top - shows the most common value
- Freq - shows the most common value’s frequency
Code for numeric:
movies.describe()Result:
Image Source: Pandas DataFrame, Edlitera
Code for non-numeric:
movies.describe(include=["object"])Result:
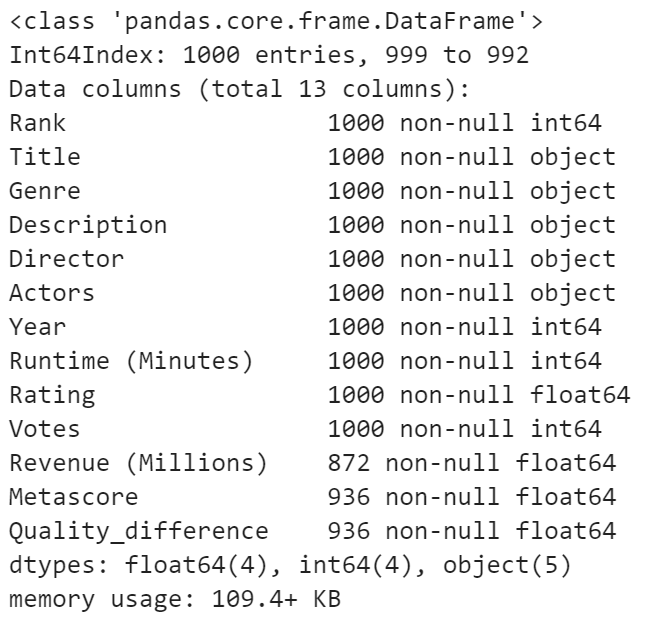
DataFrame.info()You use the info() method to find out some general information about your dataset.
It will give you information about:
- The type of data you have in each column
- How many data points there are
- How much memory your dataset takes up
Code:
movies.info()Result:
If you don't know how to program, anything connected to programming might seem hard and time-consuming, but this couldn't be further from the truth when it comes to Pandas. If your work involves a lot of data wrangling or analysis, switching from Excel to Pandas could help you automate a great deal of the more boring parts of your work.
Gaining some basic proficiency in Pandas takes very little time, even if you have no programming experience. Just as with every other tool, Pandas is very easy to use on a basic level. Unlike other tools, you can achieve a lot using just the basics of Pandas. In fact, the basics might be all you ever need to learn.
In this article, I showed you how to perform a few of the most common tasks in both Pandas and Excel. Excel might seem simpler to use at first because a lot of tasks can be completed by opening different tabs or clicking on cells. Hopefully, the examples in this article proved that you can perform different tasks much faster in Pandas than in Excel. This does not mean that you have to completely switch to Pandas from Excel. Instead, you can start by using Pandas for those tasks that you find tedious and repetitive.
Change is hard, and learning to use a new tool can seem difficult and time-consuming enough to give up before even starting. Give Pandas a try! You might find that you enjoy using it a lot, or that you enjoy all the time it can save you. In the end, the important thing is to keep an open mind and at least try out a tool that might make your life simpler.

![[Future of Work Ep. 1] Future of Fashion: Using Data to Predict What Will Sell with Julie Evans](https://res.cloudinary.com/edlitera/image/upload/ar_16:9,c_fill,f_auto,q_auto,w_100/56ar4tdmijwmrgnhoq4f56kcoddw?_a=BACJ3SGT)