


Table of Contents
Performing a detailed analysis of a DataFrame is one of the most common things you will always do. It is something performed not only by data analysts but also by data scientists and machine learning engineers. However, from time to time you might want to just take a quick look at what your data looks like, or take a peek at some basic statistics that describe it.
This is usually done at the beginning of every project, but also whenever we make any substantial changes to the data we are working with. The methods that I will mention in this article serve as both a good place to start when analyzing data, and a good way of performing sanity checks during the process of detailed data analysis.
- Intro to Pandas: What is Pandas in Python?
- Intro to Pandas: What Are Pandas Series Objects?
- Intro to Pandas: What is a Pandas DataFrame and How to Create One
Article continues below
Want to learn more? Check out some of our courses:
How to Look at Your DataFrame
After you store data in a Pandas DataFrame, you usually want to immediately take a look at it.. Because Jupyter notebooks are commonly used to work with Pandas in Python, you can just enter the name of the particular variable connected to the DataFrame and, because Jupyter always displays the result of evaluating the last row of some cell, you will get a display of your DataFrame.
However, when you’re working with large datasets, that is a bad idea. It’s a much better idea to look at just part of your data. This is what the head() and tail() methods allow you to do.
Let's demonstrate how you use these two methods:
First, I am going to create a DataFrame from data stored as a CSV file in my public S3 bucket. I don't even need to download the file before creating a DataFrame from it; Pandas can load data directly from the S3 bucket if I supply the link that leads to it.
# Create DataFrame
df = pd.read_csv("https://edlitera-datasets.s3.amazonaws.com/Sales_data.csv ")
Now that I have created my Pandas DataFrame and stored the data from the CSV file inside it, I can use the head() method to take a look at the first few rows of my DataFrame:
# Display the first five rows of the DataFrame
df.head()
The code above will result in the following display:
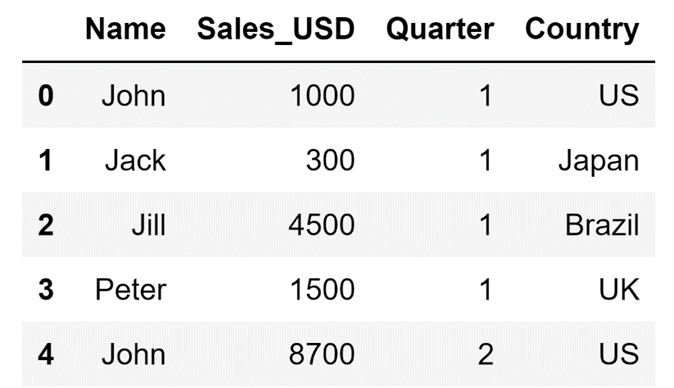
Technically speaking, the head() method shows the first n rows of the DataFrame, where n is any number from the range between 1 and the total number of rows I have in my DataFrame. The default value of n for the head() method is five, but if I want I can take a look at the first ten rows of the DataFrame by setting a new value for the n parameter.
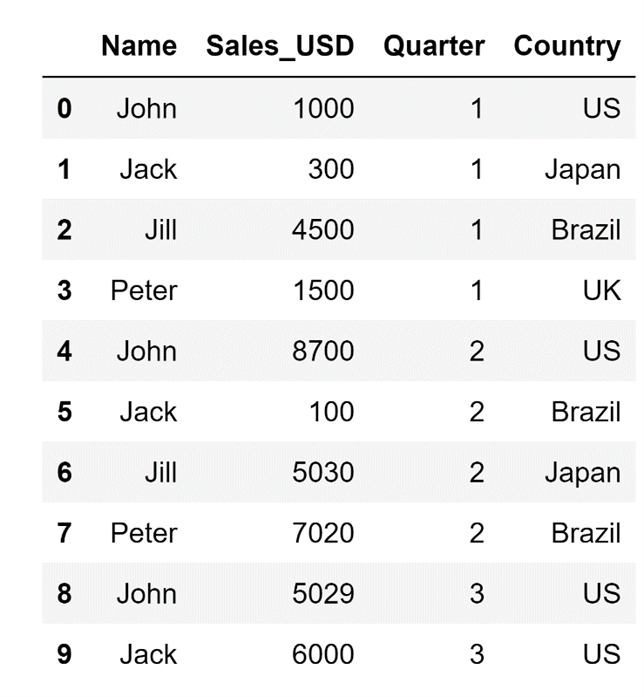
# Display the first ten rows of the DataFrame
df.head(n=10)
The code above will result in the following display:
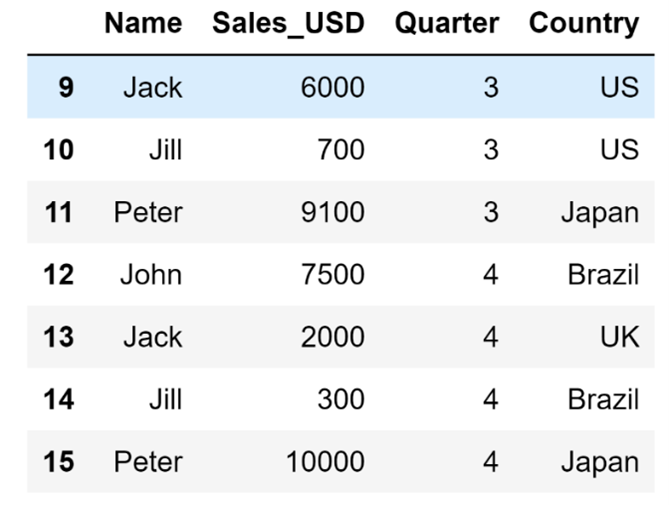
The tail() method on the other hand does the exact opposite: it allows me to take a look at the last few rows of my DataFrame. The default value for n for the tail() method is also five, so if I don't supply the tail() method with an input value for n.
I am going to get a display that shows the last five rows of my DataFrame:
# Display the last five rows of the DataFrame
df.tail()
The code above will result in the following display:
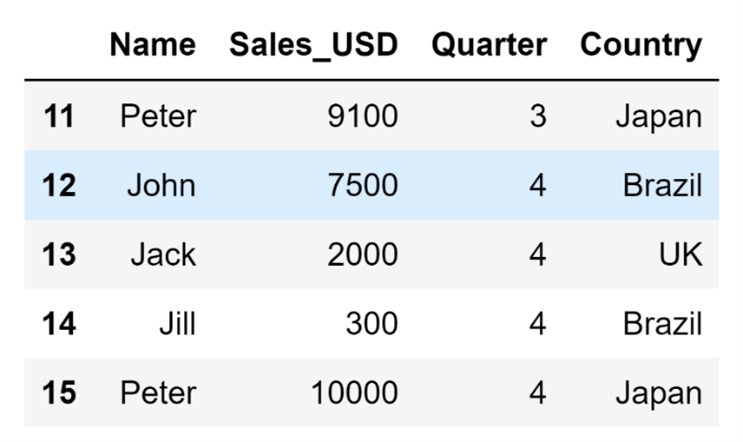
If I define some other value for n, I can get the last n rows of my DataFrame:
# Display the last seven rows of the DataFrame
df.tail(n=7)
The code above will result in the following display:
How to Display Basic DataFrame Information
You can do much more than just take a look at certain rows in your DataFrame. For example, you can access basic DataFrame information such as:
- The names of the columns in your DataFrame
- The data types of your columns
- How many rows you have in your DataFrame
- How many rows with missing data in your DataFrame
- What type of index your DataFrame uses
- How much memory your DataFrame uses up
All the information mentioned above can be accessed using just one line of code. To be more precise, you can use the info() method to access this information.
# Access basic DataFrame information
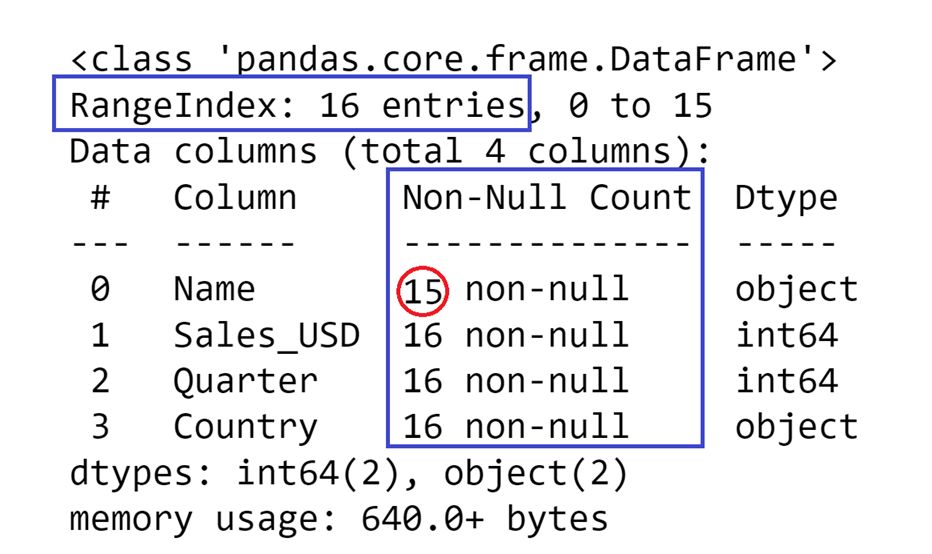
df.info()The code above will result in the following display:
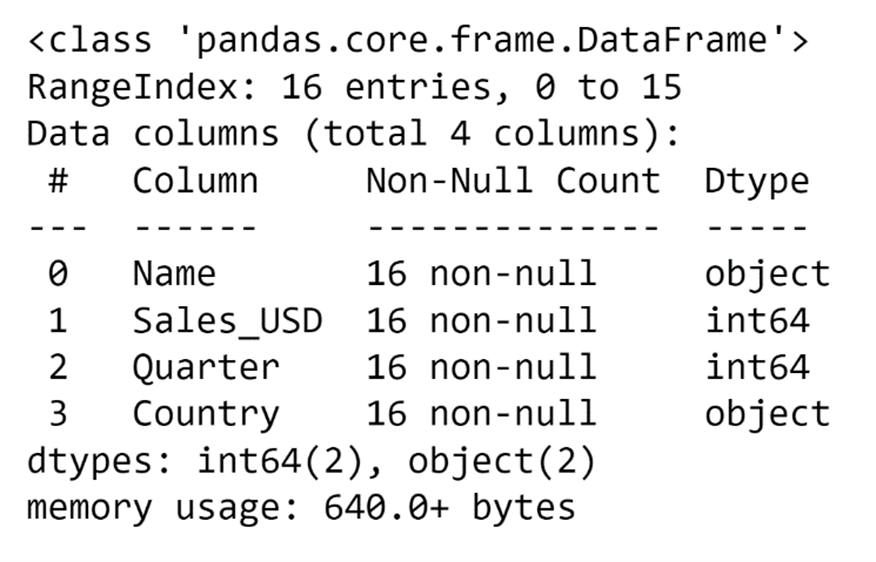
The first thing you will notice on the display is that it tells you the names of your columns in the Column section and what type of data is stored in that column in the Dtype section:
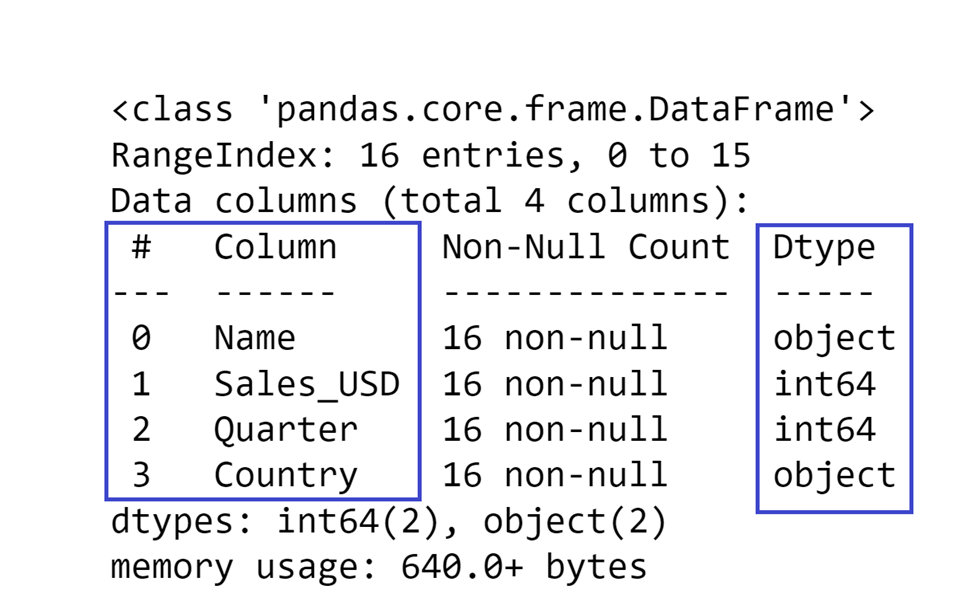
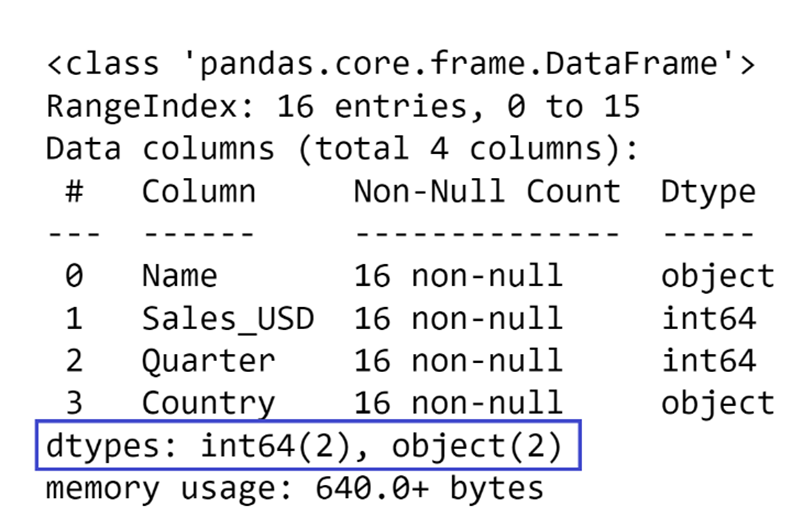
There is also a very useful summary at the bottom that tells you how many columns of certain data types you have:
At the top of the display, you can see what type of index your DataFrame uses, and how many rows you have in your DataFrame (defined as the number of entries). This allows you to not only get a general idea of how big your DataFrame is but also to see whether there is missing data or not in the DataFrame.
The Non-Null Count section of this display shows you how many rows you have in a particular column that are not missing data. If you compare those values with the number of entries in the index, you can determine whether you have missing data in a column or not.
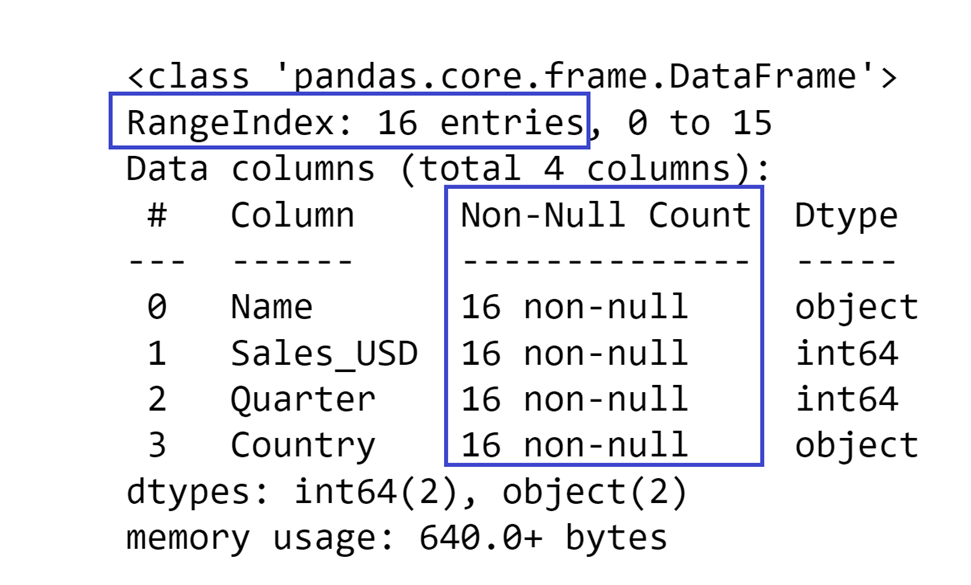
In this example, it is easy to see that no data is missing because the number of entries in the index matches the number of non-null values in the columns.
But if I were to remove a value from some row on purpose, the final result would look similar to this:
Finally, at the bottom of the display there is a section called memory usage which shows how much space the DataFrame takes up in memory:
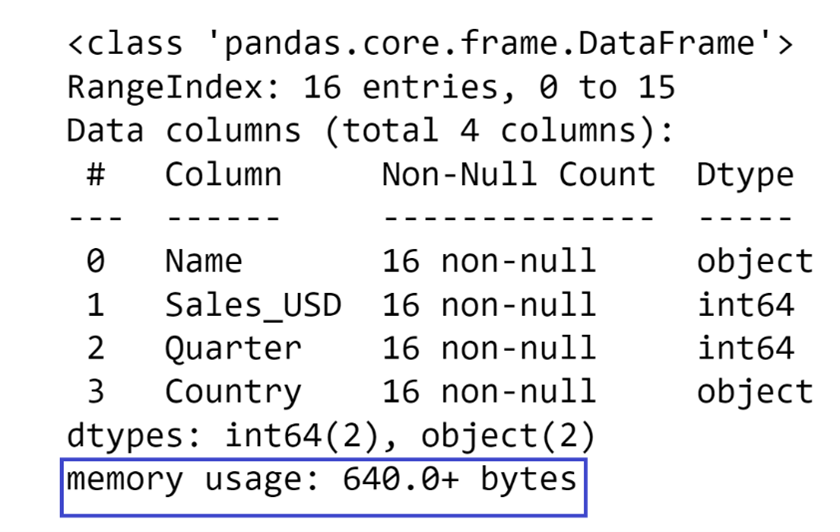
In this case, the DataFrame is very small, so it doesn’t take up that much space. But once you start working with DataFrames that have dozens of columns and thousands of rows, this value can become relatively big pretty fast.
How to Perform Basic Statistical Analysis on a DataFrame
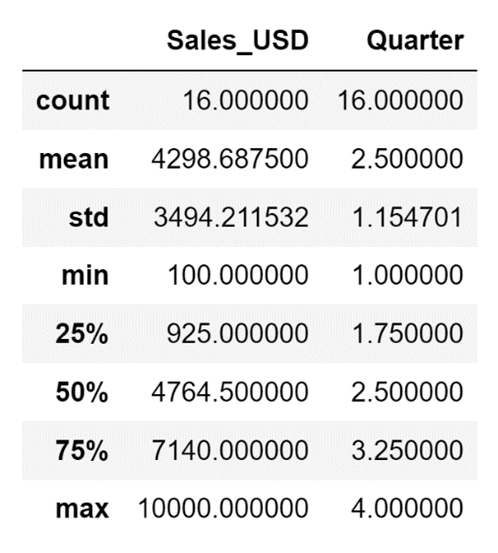
Performing a detailed analysis of some data typically includes a lot of data manipulation, such as creating pivot tables, or aggregating data, merging the results from different analyses together into a new DataFrame, etc. All these operations require writing quite a bit of code, but if you just want to perform a quick statistical analysis of a Pandas DataFrame you can use the describe() method.
By default, the describe() method will take a look at the numeric columns stored in your DataFrame and return the following information about them:
- The number of non-null rows in a column - count
- The minimum value that appears in the column - min
- The maximum value that appears in the column - max
- The mean of the values that appear in the column - mean
- The standard deviation of the values that appear in the column - std
- The 25th, 50th, and 75th percentile - 25%, 50%, and 75%
# Perform basic statistical analysis of a DataFrame
df.describe()
The code above will result in the following display:
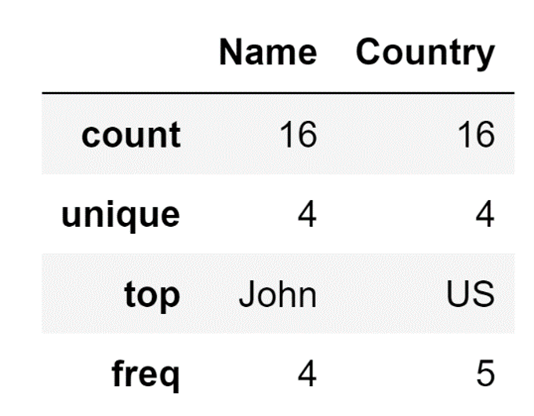
This is somewhat incomplete, as from time to time you might want to also perform a basic analysis of the columns that don't contain numeric data. There is a way to use the describe() method to analyze data that contains data such as strings, and that is to use the include parameter of the method.
With the include parameter you can define exactly which type of data you want to analyze, so, for example, if you set the value to O (abbreviation for object, which is what you use to define string data) you are going to end up with an analysis that is a little bit different.
It will contain:
- The number of non-null rows in a column - count
- How many unique values appear in that column - unique
- The value that appears most frequently - top
- How many times does the most frequent value appear - freq
# Perform basic statistical analysis of the columns containing strings
df.describe(include=["O"])
The code above will result in the following display:
This, however, only displays columns that contain strings. Generally speaking, numbers and strings are not the only two data types that can be stored in Pandas DataFrames, so to make you will analyze all columns except for the ones that have numbers inside of them, you actually need to use the exclude parameter of the describe method to define that you want to exclude numeric data and analyze all non-numeric data.
# Perform basic statistical analysis on all non-numeric columns
df.describe(exclude=[np.number])
The code above will result in the same display I showed you earlier, but that is only because, in this case, I only have non-numeric columns of the object type.
In this article, I spotlighted four very versatile Pandas methods: head(), tail(), info(), and describe(). These methods are some of the most commonly used methods in data analysis. You use them both at the start of performing some exploratory data analysis and also after every big change to your data. Since they are used so often it is very important to know exactly how to use these four methods and what information they actually provide you with. After going through this article you should be ready to use these four methods as integral parts of your data analysis pipelines.

