


Table of Contents
<< Read the previous article in the series: Intro to Pandas: How to Create and Analyze Basic Pandas DataFrames
While you can perform some basic DataFrame analysis using methods, such as the info() method and the describe() method, that is usually not enough. When exploring your data, you often need to perform more detailed analysis of some data you are working with. To make performing a detailed analysis of data as easy as possible, programmers tend to group data. To be more precise, you can create pivot tables in Pandas.
- Intro to Pandas: What is Pandas in Python?
- Intro to Pandas: What Are Pandas Series Objects?
- Intro to Pandas: What is a Pandas DataFrame and How to Create One
- Intro to Pandas: How to Add, Rename, and Remove Columns in Pandas
Pivot tables are tables of grouped values that aggregate specific items of an original table into one or more discrete categories. Put simply, they are a way of creating short summaries of your original dataset that display things such as sums of columns, averages, or any other statistic value you are interested in. By summarizing large amounts of data into pivot tables, you'll usually notice some patterns in it which helps deduce how your data behaves based on certain factors. This knowledge is very useful because it can help subject matter experts make better strategic decisions.
The pivot tables you can create in Pandas are actually very similar to the pivot tables you can create in Excel. However, that doesn't necessarily need to apply to the process of creating them.
In general, there are two ways of creating pivot tables in Pandas: One method is very similar to how you create pivot tables in Excel, while the other way is more akin to summarizing and aggregating data with SQL. The result you'll get in the end is basically the same, so using one method or the other is purely a matter of preference.
Former Excel users will probably prefer using the pivot_table() method, as it is similar to how pivot tables are created in Excel, while former SQL users will probably prefer using the groupby() method. If you don't have a background in either Excel or SQL don't worry; using both of these methods to create pivot tables is very easy, so you can pick the one you prefer.
What is the Pivot_Table() Method in Pandas
The pivot_table() method is a method that allows you to create pivot tables in Pandas in a way very similar to performing the same task in Excel. That is why it is the preferred method of summarizing and aggregating data in Pandas for former Excel users.
To create a pivot table using this method you need to define values for the following parameters:
- Index
- Columns (optional)
- Values
- Aggfunc
The Index Parameter
The index parameter defines what is going to be the index of your pivot table. For example, it defines how the rows of your original DataFrame are going to be grouped into categories. If you input a list of values instead of just one value, you are going to end up with a multi-index as your row index.
Also called a hierarchical index, a multi-index allows you to group your data into multiple categories at once. Instead of assigning a single value as a label to your row, you assign a tuple with multiple values. For example, if one of your rows is defined with the tuple ("Anne", "live") and another is defined with a tuple ("Anne", "online") they will both belong to the same higher level group ("Anne") and will, at the same time, belong to two different lower level groups (one group is "live," another group is "online").
Article continues below
Want to learn more? Check out some of our courses:
The Columns Parameter
The columns parameter is an optional parameter that allows you to introduce an extra value to your columns index, which in turn transforms your pivot table column index into a multi-index.
The Values Parameter
The values parameter defines which columns you want to aggregate. Essentially it tells Pandas what it needs to aggregate based on some aggregation function after your data has been grouped based on the values you entered for the index parameter.
The Aggfunc Parameter
The aggfunc parameter defines which type of aggregation you want to perform. Based on what you decide to use here, you can access various information such as the means, the sums, etc. If you want to, you can also enter multiple values here which will end up transforming your column index into a multi-index.
How to Create a Pivot Table in Pandas
Let's demonstrate how to create pivot tables from an example dataset stored in my public S3 bucket. First, I am going to import everything I need for this example, which is in this case just Pandas.
# import the libraries I plan on using for this example:
import pandas
After I can go ahead and load my data from the CSV file. To do so I am going to use the read_csv() method from Pandas. I am also going to parse the data in the Date column using the parse_dates argument since that column contains timestamps.
This is important because I will be using that column later in this example in Jupyter notebook:
# Load in data
# and create a DataFrame from it

data = pd.read_csv(
  'https://edliteradatasets.s3.amazonaws.com/pivot_tables_article_data.csv',
  parse_dates=['Date']
)
Now that I've created my DataFrame, let's take a look at the first five rows using the head() method from Pandas:
# Take a look at the first five rows
# of the DataFrame

data.head()
Running the code above will result in the following display:
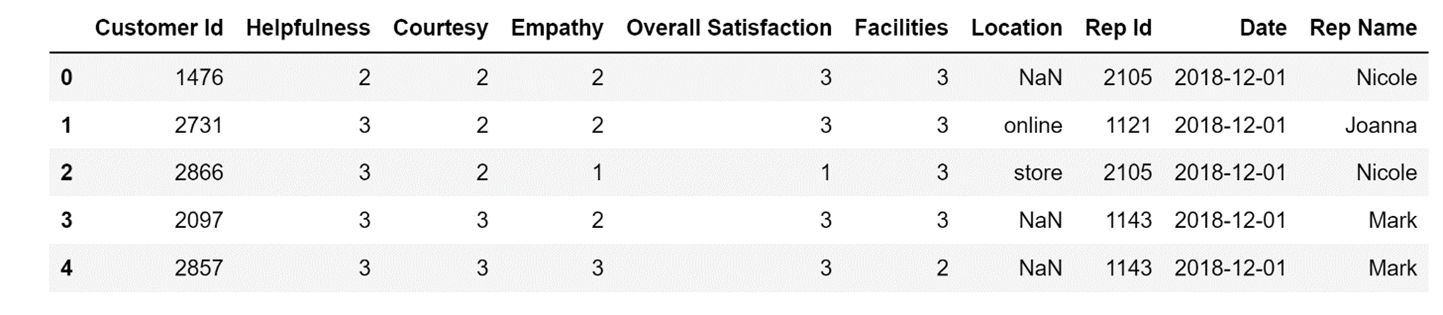
Now that I have some data I can work with, I can create pivot tables from it.
For example, let's take a look at the average scores for helpfulness, courtesy, and empathy for each representative. To do so I am going to set the Rep Name column as my pivot table index. I am going to enter a list that contains three column names (Helpfulness, Courtesy, and Empathy) as the value of my values parameter.
Finally, to get the averages, I am going to set the value of my aggfunc parameter to mean:
# Create a pivot table
# that displays average values
# for the three categories for each representative

data.pivot_table(
    index='Rep Name',
    values=['Helpfulness', 'Courtesy', 'Empathy'],
    aggfunc='mean')
Running the code above will result in the following display:
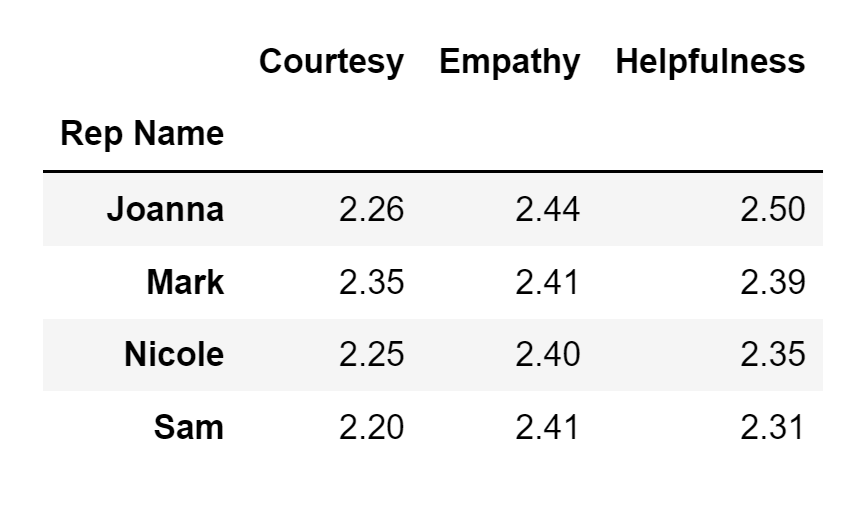
Based on the pivot table I created, it looks like Joanna is overall the best performing representative: she is second best in terms of Courtesy, but is the best in terms of Empathy and Helpfulness.
Let's make this analysis more detailed by also analyzing the standard deviation. To do so, I just need to enter a list of the two values I am interested in (mean and standard deviation, or std) as the input for my aggfunc parameter, instead of entering just one value:
# Create a pivot table
# that displays average values and the standard deviation
# for the three categories for each representative

data.pivot_table(
    index='Rep Name',
    values=['Helpfulness', 'Courtesy', 'Empathy'],
    aggfunc=['mean', 'std'])
Running the code above will result in the following display:
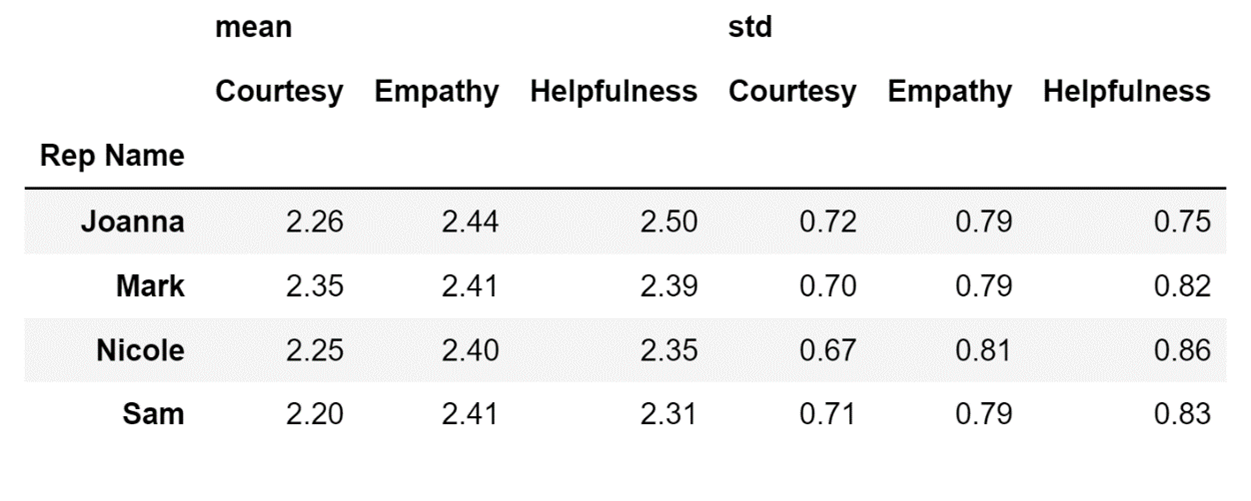
The pivot table above shows that there is quite a big difference in how different people scored Joanna. Since the values for this dataset for these three columns range from 1 to 3, having a standard deviation of 0.79 for Empathy means that there are some people who were not satisfied with how Joanna performed, and have therefore given her a bad score for this category.
This is not all I can do. Let's check out whether the performance of my representatives has stayed consistent by creating a pivot table with a row multi-index that will contain not only the Rep Name column data, but also data from the Date column.
To do so, I will just enter a list containing these two column names as the value for my index parameter instead of entering just one value:
# Create a pivot table
# that displays average values and the standard deviation
# for the three categories for each representative
# for different dates

data.pivot_table(
    index=['Rep Name', 'Date'],
    values=['Helpfulness', 'Courtesy', 'Empathy'],
    aggfunc=['mean', 'std'])
Running the code above will result in the following display:
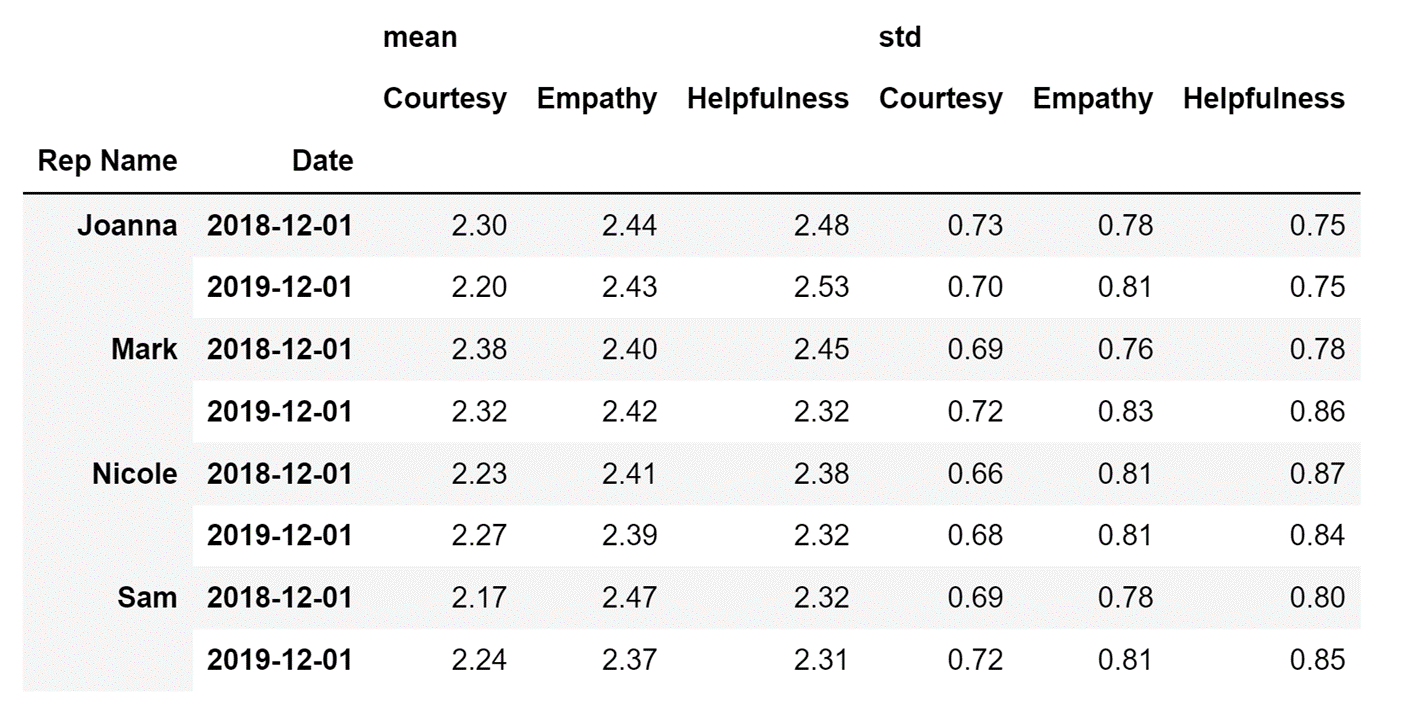
The pivot table above shows that most representatives are less empathic and less helpful in 2019 than they were in 2018, which is a worrying trend for any company.
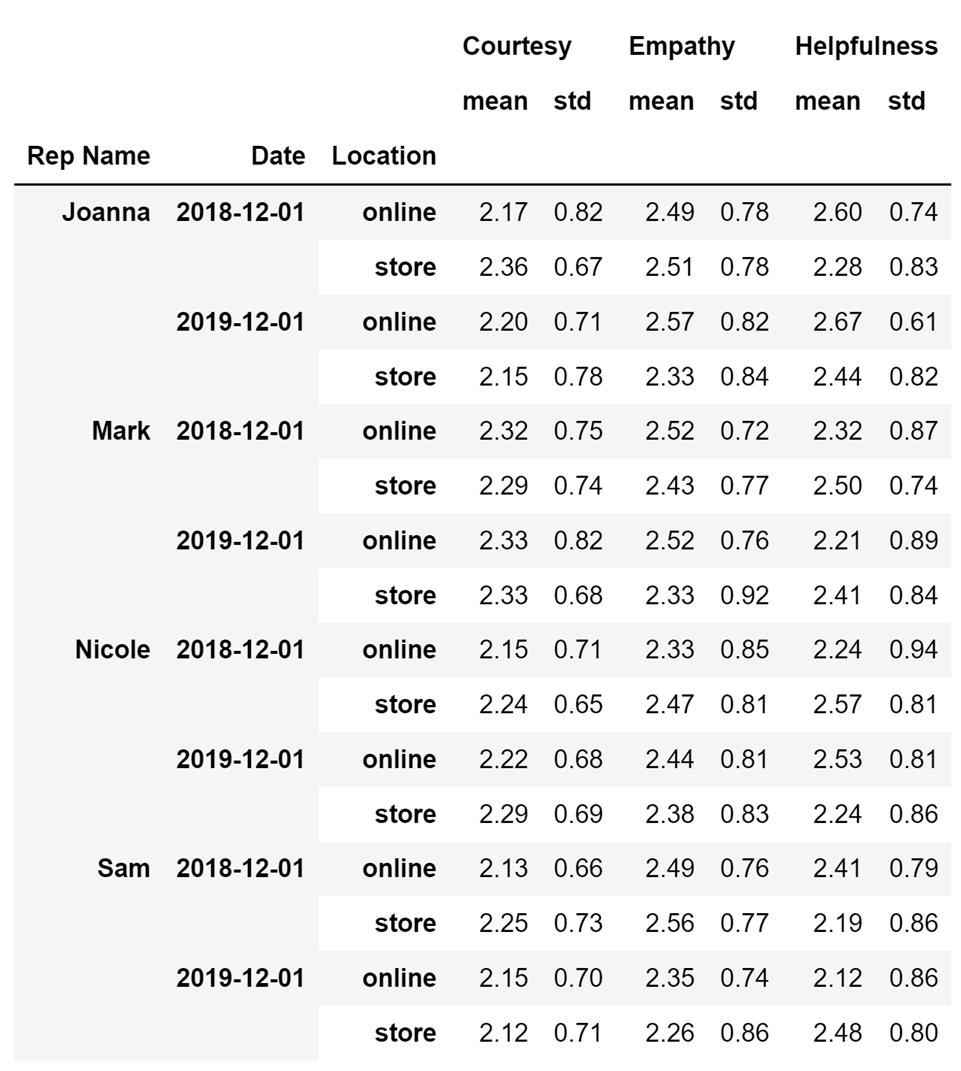
Let's also take a look at whether the representatives perform the same offline and online. I will do this by entering a value for the optional columns parameter that represents where the representatives performed their tasks, and that is the Location column name.
# Create a pivot table
# that displays average values and the standard deviation
# for the three categories for each representative
# for different dates
# offline and online


data.pivot_table(
    index=['Rep Name', 'Date'],
    columns=['Location'],
    values=['Helpfulness', 'Courtesy', 'Empathy'],
    aggfunc=['mean', 'std'])
Running the code above will result in the following display:
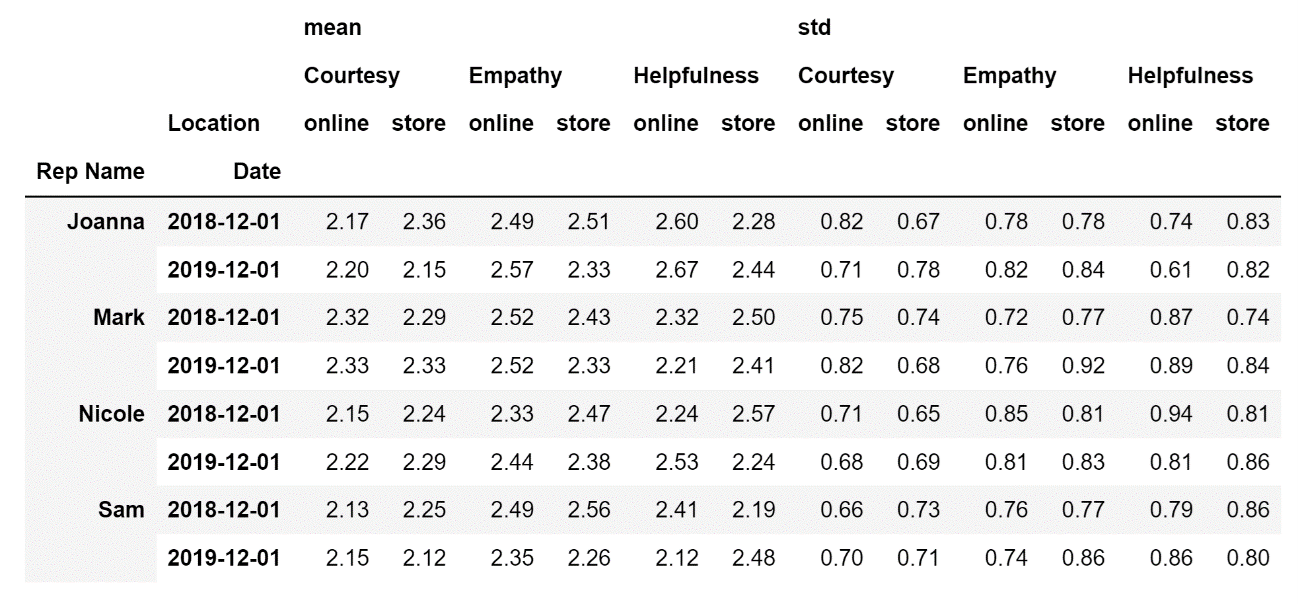
By looking at the pivot table above it is easy to conclude that the representatives are not very consistent in their performance. In most cases, there is a substantial difference between how they perform when working in a store and when they are working online. So if this were my company, I would certainly investigate further to try and find out the underlying reason for why the performance of my representatives are not consistent.
How to Use the Groupby() Method in Pandas
The way the syntax of the groupby() method works is a bit different and somewhat harder to explain.
To simplify the explanation let's reference the following image:
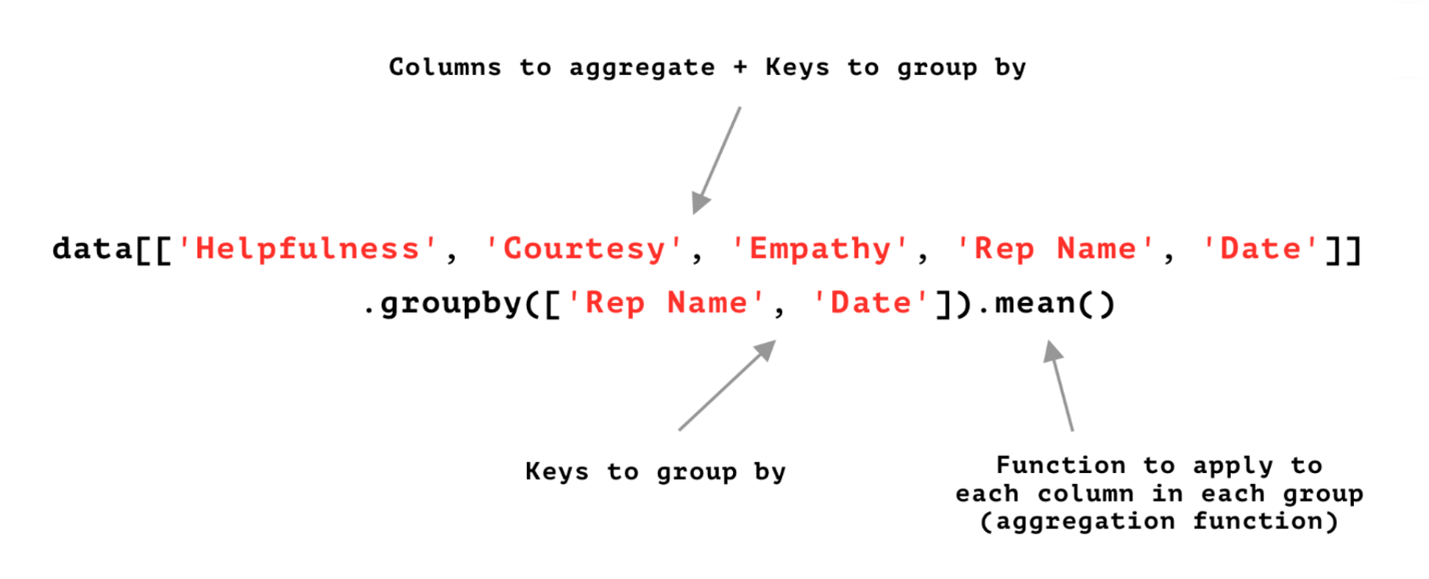
Let's summarize what is explained in the image above:
The first step is to select all the data that you want to include in a pivot table. The easiest way to do this is to just define which columns from the original DataFrame need to be included in the pivot table.
The next step is to apply the groupby() method to the previously defined set of columns. Those columns that are entered as a list into the groupby() method will become the index of the pivot table. The aggregation function mentioned after the groupby() method will be applied to the rest of the columns. I'll demonstrate how to create the same pivot tables I just created previously, but this time using the groupby() method.
One thing worth mentioning here: the formatting of the final results can be a little bit different when you use the groupby() method. If you create multi-indices for rows or columns, the order of indices in a multi-index might be a bit different from the one you got using the pivot_table() method. But that is overall inconsequential in most cases since anyone who knows how to work with multi-indices will be able to interact with the data easily.
To create the first pivot table using the groupby() method, I am going to use the following code:
# Create a pivot table
# that displays average values
# for the three categories for each representative

(
    data[['Courtesy', 'Empathy', 'Helpfulness','Rep Name']]
    .groupby('Rep Name')
    .agg('mean')
)
One note here: the reason for using parenthesis is to tell Python, 'I will separate my code into multiple lines so that it looks nice.' Otherwise, everything above would need to be included in one line of code.
Running the code above will result in the following display:

To aggregate my data both on mean values and standard deviation (std), I will use the following code:
# Create a pivot table
# that displays average values and the standard deviation
# for the three categories for each representative

(
    data[['Courtesy', 'Empathy', 'Helpfulness','Rep Name']]
    .groupby('Rep Name')
    .agg(['mean', 'std'])
)
Running the code above will result in the following display:
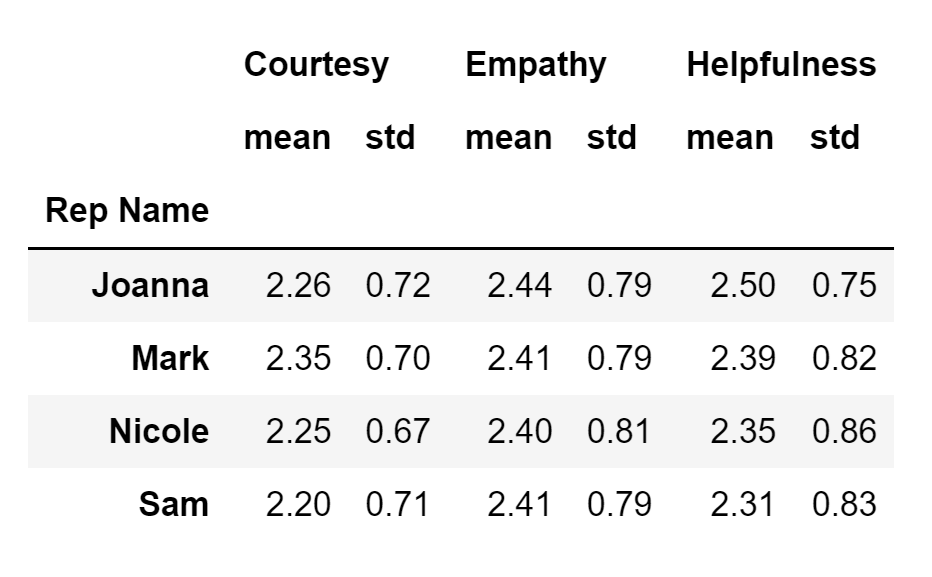
The resultant pivot table is organized a bit differently from the one I got using the pivot_table() method, but it displays the same information.
To aggregate my data both on mean values and std, while at the same time using a row multi-index that consists of the Rep Name and Date columns, I will use the following code:
# Create a pivot table
# that displays average values and the standard deviation
# for the three categories for each representative
# for different dates
(
data[['Courtesy', 'Empathy', 'Helpfulness','Rep Name', 'Date']]
.groupby(['Rep Name', 'Date'])
.agg(['mean', 'std'])
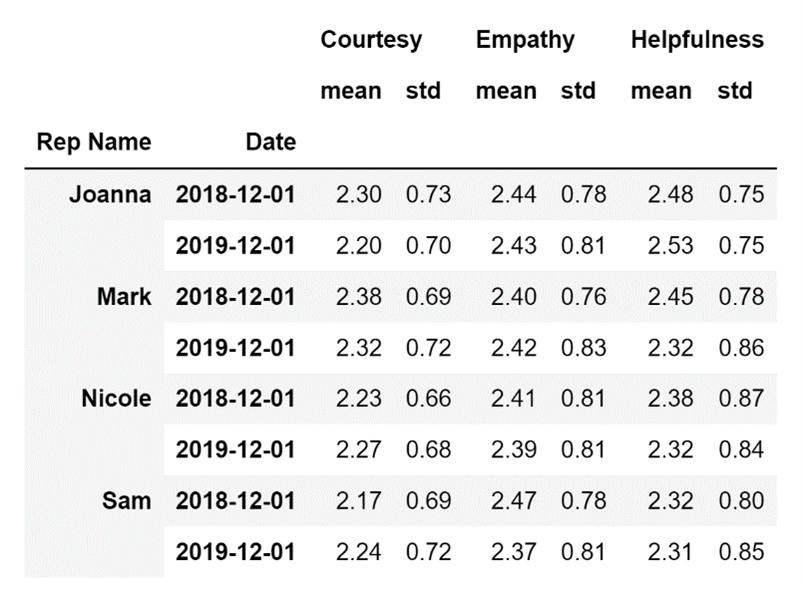
)Be very careful: when writing the code above, I had to add the Date column to both the first line of code and the second line of code for my groupby() procedure to work. Before selecting that I want to group based on some column, I need to add it to the overall set of columns I will be using to create the pivot table.
Running the code above will result in the following display:
Unfortunately, there is no easy way to replicate the last pivot table I created using the pivot_table() method. The best I can do is include it in a row multi-index, which will allow me to access the same information but in a visually harder-to-interpret way.
# Create a pivot table
# that displays average values and the standard deviation
# for the three categories for each representative
# for different dates
# offline and online

(
    data[['Courtesy', 'Empathy', 'Helpfulness','Rep Name', 'Date', 'Location']]
    .groupby(['Rep Name', 'Date', 'Location'])
    .agg(['mean', 'std'])
)
Running the code above will result in the following display:
In this article, I covered the two methods you can use in Pandas to create pivot tables. Creating pivot tables is an essential part of performing data analysis, so knowing how to create them in a fast and efficient manner is very important for anyone aspiring to work in any field connected to data analysis.
First, I went over the pivot_table() method, explaining how to use it to create simple and complex tables. While demonstrating how to create pivot tables, I also analyzed the pivot tables to try and find some patterns in my data. Later, I performed the same tasks I performed using the pivot_table() method using the groupby() method. I compared the two methods and pointed out their similarities and differences.
The conclusion is that, while they produce very similar results, both methods function a bit differently and it is advised to pick one and stick with it in your work.
- Read next in the series: Intro to Pandas: How to Merge DataFrames >>

