


Table of Contents
Our Pandas DataFrames sometimes contain information that is not useful and needs to be removed. To remove this data from our DataFrame we can either drop certain rows or certain columns. In this article, I will focus on explaining ways to drop columns. In addition, another article will cover how we drop rows. To be more precise, I will explain how we drop columns based on their name, a certain condition, and their index.
Article continues below
Want to learn more? Check out some of our courses:
How to Drop Columns from a Pandas DataFrame
There are several methods to remove columns from a Pandas DataFrame. You can either specify the column name, point to the index position of the column or remove them based on specific conditions. Some people might argue that removing columns based on conditions is more about filtering the DataFrame, rather than deleting data. However, the difference seems more semantic than practical.
For starters, let's create a simple DataFrame for the purpose of data removal.
# Import what we need
import pandas as pd
import numpy as np

# Create an example dictionary
data = {
    'Name': ['Alice', 'Bob', 'Charlie', 'David'],
    'Age': [25, 30, 35, 40],
    'Occupation': ['Engineer', 'Accountant', 'Developer', 'Manager'],
    'Salary': [50000, 60000, 70000, np.nan],
    'Department': ['HR', 'Finance', 'Engineering', 'NaN']
}

# Create a DataFrame from our example dictionary
df = pd.DataFrame(data)
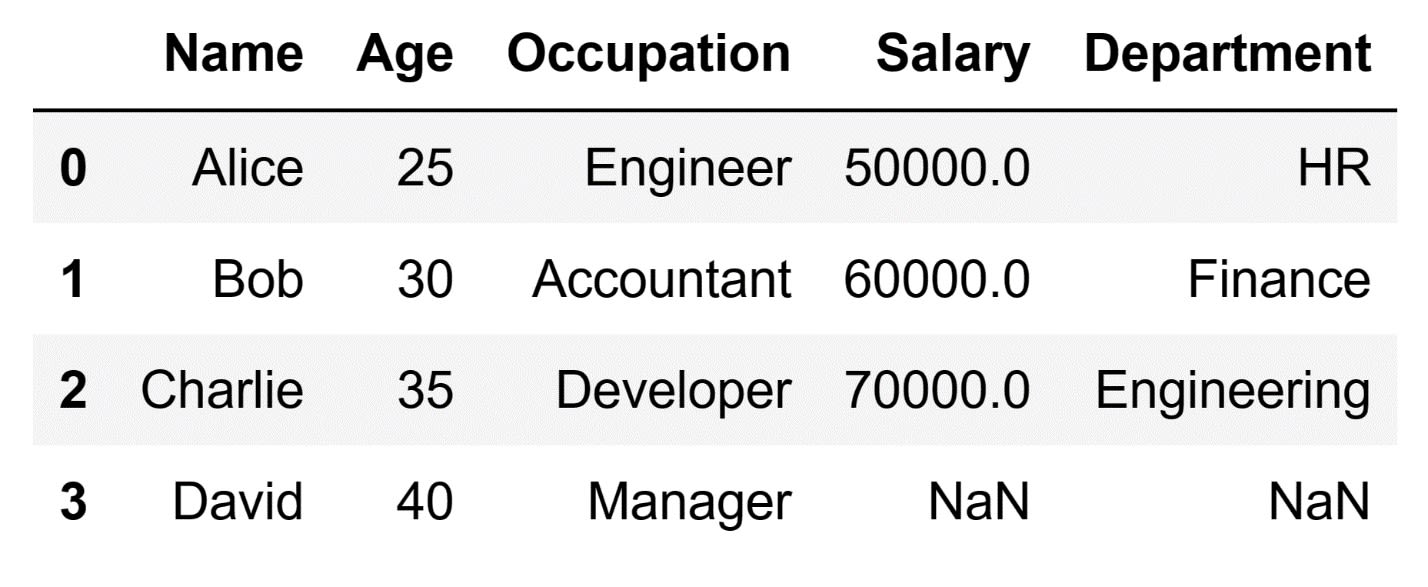
Running the code above will result in the following DataFrame:
A quick look at the resulting DataFrame will show that there are missing values in both the 'Salary' and 'Department' columns. However, it appears that there are no duplicates in our DataFrame. In practice, when we clean data, we always deal with missing data, and almost always remove duplicates.
- Intro to Pandas: How to Create Complex Derived Columns in Pandas
- Intro to Pandas: How to Add, Rename, and Remove Columns in Pandas
How to Drop Columns Based on Their Name
Dropping columns based on their name is another possible method. We can drop a single column, or even multiple columns at a time. To demonstrate, let's drop the 'Department' column from our Pandas DataFrame by referencing its name. To be more precise, I will use the drop() method. When applying the method, we simply need to define which columns we want to drop. This is done by entering a list of column names as a value for the columns argument. We can set the inplace argument to True in order to make sure the changes are applied directly to the original DataFrame
# Remove the 'Department' column
df.drop(columns=['Department'], inplace=True)
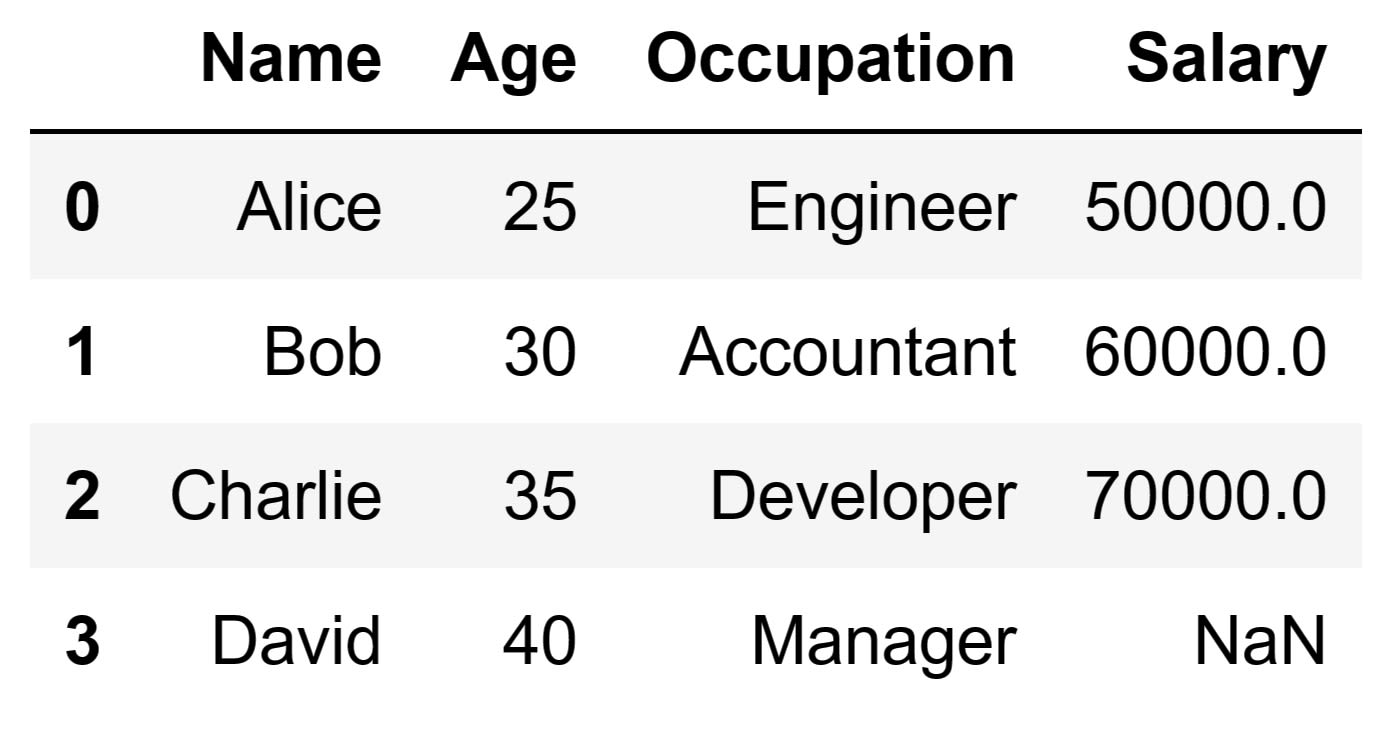
Running the code above will drop the 'Department' column. As a result, we will end up with the following DataFrame:
When you instruct Pandas to drop columns by their names using the drop() method, it performs an initial check to confirm the existence of the specified columns within the DataFrame. If any of the specified column names do not exist in the DataFrame, Pandas will raise a KeyError. This shows that the specified labels are not found in the DataFrame's axis. Something similar cannot be found in the behavior for rows, where no error is raised if a specified index label doesn't exist. If the specified columns do exist, they will simply be removed from the DataFrame.
This technique is particularly helpful when you have a clear understanding of which columns are not useful or relevant for your data analysis or modeling tasks. It allows for precise, targeted removal of data columns that may be redundant or irrelevant.
How to Drop Columns Using Their Index
In addition to deleting columns by their names, you can also eliminate them by referring to their index positions. Each Pandas DataFrame has an attribute called columns that stores the index of its columns. When you access the columns attribute of a DataFrame, it provides a list of all the names of the columns in that DataFrame. For example, you can see the list of columns by running the following code:
# Retrieve a list of the existing columns in our DataFrame
df.columns
The code above will provide the following:
After that, we can use the index position of the column to drop it. For example, let's drop the 'Age' column. This is the second column in our DataFrame. In order to drop it, we need to run the following code:
# Remove the 'Age' column
# It is the second column in our DataFrame
df.drop(columns=[df.columns[1]], inplace=True)
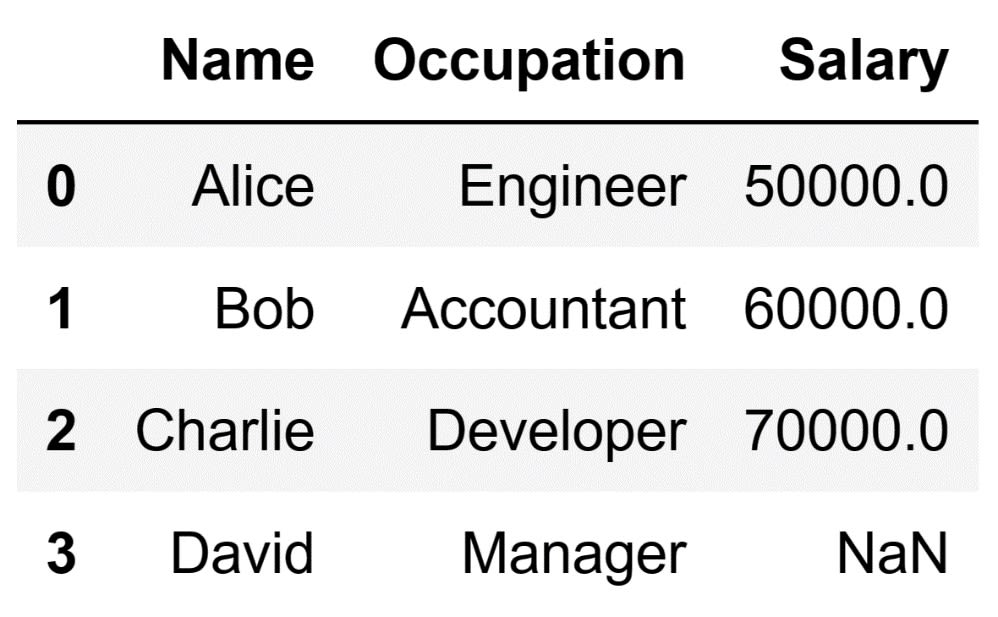
By running the code above, the following DataFrame will appear:
By using this method, Pandas goes through a few internal steps. First, it looks at the given index position, in this case, df.columns[1] which corresponds to the 'Age' column. Afterward, it locates that column in the DataFrame, and removes it. If the column index does not exist, it will produce an IndexError. Doing this indicates that the particular index that you are referencing does not exist.
This approach is especially helpful when working with DataFrames where column names are not known in advance or can change dynamically. If the position is known, but not the name of the column you want to remove, or if the DataFrame is being generated dynamically and the column names may vary, you can securely remove columns using their index positions.
- Intro to Pandas: What is a Pandas DataFrame and How to Create One
- Pandas vs Excel: Which Is the Best for Data Analysis?
How to Drop Columns with Missing Values
Almost like removing rows with missing values, you can also eliminate columns that have missing values. However, there's a key difference: we don't usually drop an entire column if only a few values are missing. In such cases, it's often more practical to just remove the specific rows with missing values. The need of dropping an entire column usually arises when it contains a significant number of missing values. In these cases, it is not suggested to try and fill in the missing data or delete the affected rows. Therefore, it is best to remove the column altogether.
In our specific case, let's drop the columns that contain missing values from our DataFrame. To be more precise, there is only one column that is missing values, and it has only one missing value. In practice, we would usually not drop the whole column because of that single missing value. Thus, I will demonstrate how to instruct Pandas to drop all columns with a certain percentage of missing values.
To drop columns with a certain percentage of missing values you can use the dropna() method:
# Remove columns with missing values
df.dropna(axis=1, thresh=2, inplace=True)
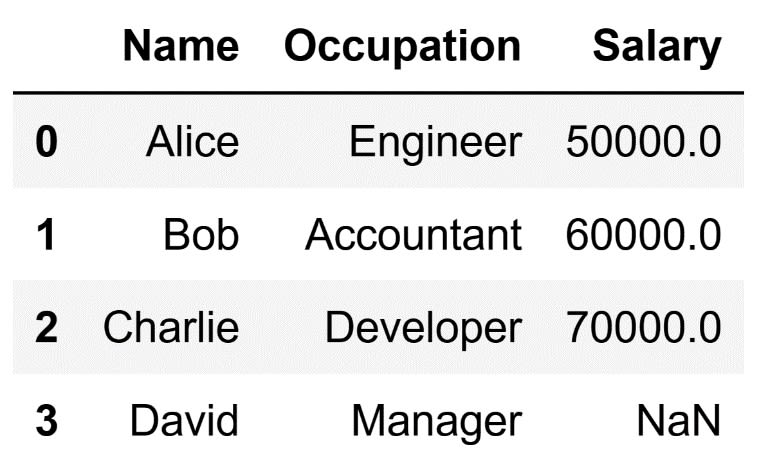
The code above will result in the following DataFrame:
As you can see, the column with the missing data was not removed. This happens as a result of the underlying operation of the dropna() method.
The axis argument tells Pandas if we wish to look at rows or columns. If axis=0, we are looking at rows. If axis=1, we are focusing on columns. The thresh argument is the equivalent of setting a minimum score for each column. This score is the number of real, or 'non-null', values that a column must have for us to keep it. It is not about counting the missing values. It is rather about counting the values that are actually there.
The thresh argument can be a bit tricky to understand at first. However, you can simplify it by tying it to a percentage of your DataFrame. For example, if you want to remove columns that lack more than 30% of their data, you could focus on keeping those that have at least 70% of their data. This can be done by linking thresh to the total number of rows in your DataFrame. Here's how to do it:
# Remove columns with a certain percentage of missing values
df.dropna(axis=1, thresh=0.7*len(df), inplace=True)
By using len(df), you get the total number of rows in your DataFrame. Multiplying that by 0.7 gives the minimum number of rows that should have non-null values in each column. If a column doesn't meet this minimum, it gets removed.
However, even if I run the code above, I won't remove the 'Salary' column from my DataFrame because it is not missing 30% of its total data. The absence is limited to 25% which is typically considered acceptable in practice. Moreover, this is usually resolved through missing data imputation.
This approach of removing columns is useful when dealing with a large dataset with multiple columns. It is also helpful when you want to automatically remove columns with too many missing values, which could potentially distort your analysis or model training.
This article covered various techniques for removing columns from a Pandas DataFrame, from the basic to the more advanced. Whether you need to drop columns based on their name, index position, or even based on whether they are missing a certain amount of data, Pandas offers a rich set of methods to best perform these tasks. Understanding these methods will enable you to effectively clean your data and prepare it for further analysis.

