


Table of Contents
Machine learning models can help you solve many different types of problems, but most of them can be described as classification or regression problems. No matter the problem, you will need to evaluate a model's performance after training it. Most articles focus on evaluating the performance of classification models since beginners often need help understanding that the accuracy of a classification model is not necessarily a good indication of how well that model will perform on new, unseen data. Articles focusing on regression performance measures, on the other hand, are not as common. In this article, I will cover the most used regression performance measures and illustrate their functionality using examples and code.
- How to Use Machine Learning to Automate Tasks
- How to Summarize Text Using Machine Learning Models
- How to Evaluate Classification Models
What Is Regression?
Even though you are probably familiar with the distinction between classification and regression problems, it is still worth taking a few moments to talk about what regression actually is. Many people have an oversimplified view of regression, which can make it challenging to choose the right regression performance measure for their problem and interpret the results.
You may view regression as the task of predicting some continuous value. While true, this definition has connotations that most people don't understand. For example, super-resolution problems (i.e., problems where we want to get a high-resolution image from a low-resolution one) are also regression problems. Each pixel in an image has a numerical value associated with it, so when you increase the resolution of images, you ask your model to predict the value of each pixel in the high-resolution image based on the pixel values in the low-resolution image we feed to your model.
A deeper understanding of regression can significantly influence how you approach solving regression problems and which metric you choose to evaluate your model. Of course, you could go in blind without being familiar with your data at all, but performing some form of exploratory data analysis (EDA) to familiarize yourself with the data can greatly help you choose the right metric to evaluate your model correctly.
Article continues below
Want to learn more? Check out some of our courses:
What Are Regression Performance Measures?
When trying to evaluate how well a regression model performs, you can use a variety of different metrics. However, in most cases, you'll use one of the following:
- R2 score
- Root Mean Squared Error
- Mean Absolute Error
In exceptional cases, it might be worth considering other metrics, but I will focus on demonstrating commonly used regression performance measures that apply in most cases.
How to Calculate the R-Squared Score
The R2 score, also known as the R-Squared score, is a relative measure of performance that indicates how much better a model is at making predictions compared to the mean model. In this context, the mean model is a basic model that always predicts the mean of the dependent variable for all observations.
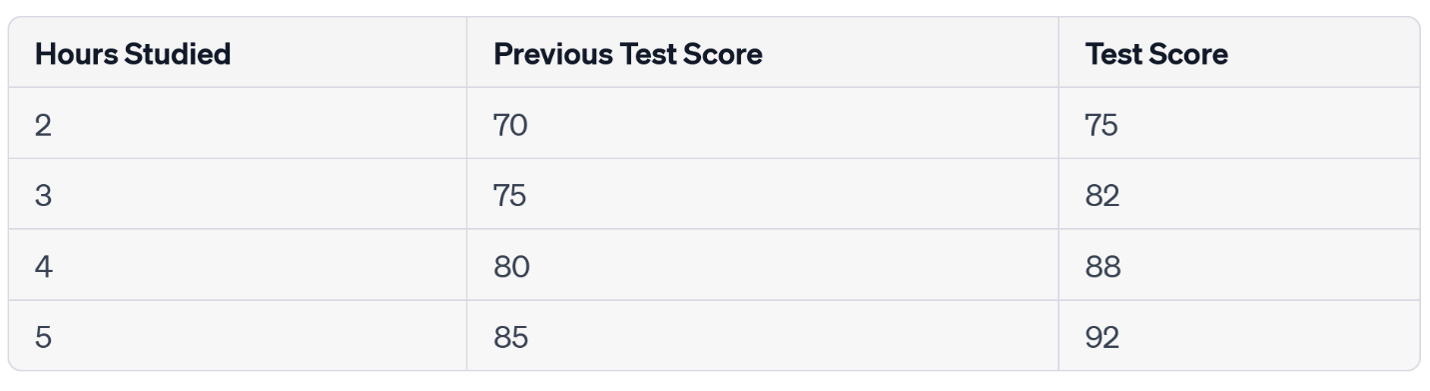
Let’s say that you are working on a simple regression problem: trying to predict the test score a student will achieve based on how much they studied and their previous test score.
The mean model would, in this case, consistently predict that the student will score the mean value of the "Test Score" column, no matter which combination of the "Hours Studied" and "Previous Test Score" variables you used. In this case, it would predict that every student will score 84.25, which is the mean of the "Test Score" column.
A regression model, on the other hand, would try to find a pattern that describes which combination of our two input variables—"Hours Studied” and “Previous Test Score”—will produce a specific result. In other words, the R-Squared helps explain how connected the changes in the independent variable values are to changes in the dependent variable. To be more technical, it represents how well the independent variables account for the observed variation in the dependent variable.
The equation we use to calculate the R-Squared score is:
\( R^2=1-\frac{\sum_{i}(y_i-\hat{y_i})} {\sum_{i}(y_i-\bar{y})} \)
In the equation above:
- R2 - R-Squared score
- yi - actual value
- ŷi - predicted value
- ȳ - mean of the actual values
The value of the R-Squared score can vary between 0 and 1, as you can easily see from the equation above. In practice, this means that if the R-squared score is 0.75, for example, 75% of the variability in the dependent variable can be attributed to the independent variables. Therefore, you want the score to be as high as possible.
However, remember that the R-Squared score is not always a good indicator of how well our model will perform because it doesn't measure the goodness of fit nor tell you anything about the predictive error. Depending on the situation, you might end up with a high R-Squared score even when your model doesn't perform well in practice and vice-versa. In practice, it is best to skip calculating the R-Squared score because many prerequisites need to be met to produce reliable results. In fact, in almost any situation especially beginners will run into, it is far easier and more reliable to put your trust into the root mean squared error or mean absolute error, which I’ll discuss later in this article. Still, let's demonstrate how we can calculate the R-Squared score, in case you need it.
The easiest way to calculate the R-Squared score is to import it from the Scikit-Learn library.
# Import the libraries we need
from sklearn.metrics import r2_score
Next, I will create some example text data. I will create two lists: one representing the actual values and one representing the values the model predicted.
# Create the list of actual values
# and the list of predicted values
actual_values = [500, 600, 213, 370, 510, 220, 490, 700]
model_predictions = [500, 600, 203, 362, 500, 225, 430, 690]
Finally, I can use the r2_score function we imported from Scikit-Learn to calculate the R-Squared score based on the actual values and model predictions:
# Calculate r2 score
r2 = r2_score(actual_values, model_predictions)
In this case, the R-Squared score I obtained is roughly 0.98. Considering the interpretation of the R-Squared score, this would imply that our model is nearly flawless. However, a closer comparison of the actual values and the model's predictions reveals this isn't exactly the case.
How to Calculate the Mean Squared Error and Root Mean Squared Error
Mean Squared Error (MSE) is a metric that measures the average squared difference between predicted values and actual values. While the MSE is a good indicator of how well a model will perform, in practice, I typically calculate the Root Mean Squared Error (RMSE) instead of the MSE because the RMSE is easier to interpret and optimize, and it is more sensitive to large errors. These advantages are mainly due to two factors:
- RMSE is measured in the same units as the dependent variable.
- RMSE penalizes larger errors more heavily during training which leads to higher-quality models.
When calculating either of the two metrics, the result should be as small as possible because that indicates that the mistakes our model makes when trying to predict actual values are relatively small.
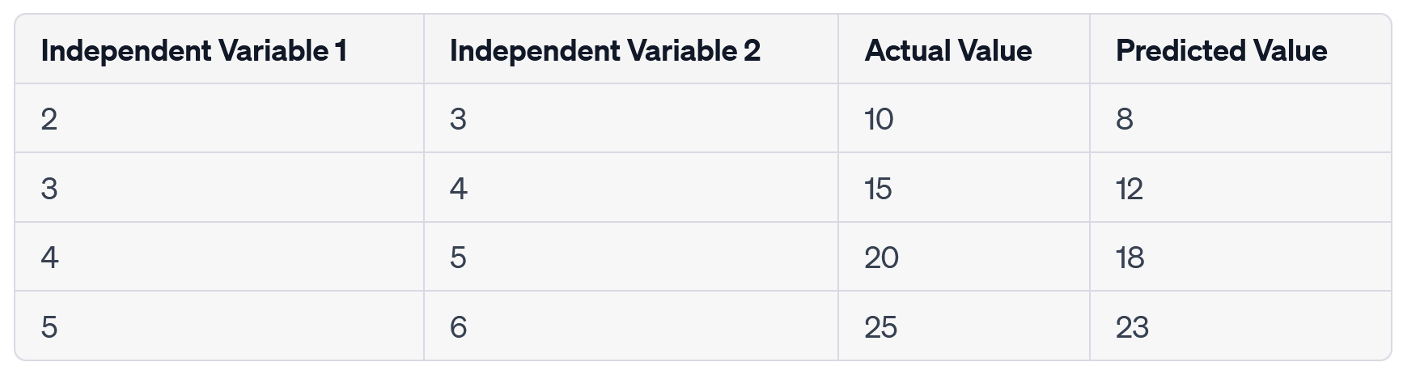
Let's demonstrate how we calculate RMSE with an example:
As you can see above, I tried predicting the actual values based on two independent variables but the model made some mistakes during the prediction. To determine how well the model performs, I can calculate RMSE using the following equation:
\( RMSE= \sqrt{\frac{1}{m} \sum_{i=1}^{m} (y-\hat{y_i} )^2 )} \)
In the equation above:
- RMSE - Root Mean Squared Error
- yi - actual value
- ŷi - predicted value
- m - number of samples
Applying this equation to the example above, I end up with:
\( RMSE= \sqrt{\frac{1}{4} ((10-8)^2+ (15-12)^2+(20-18)^2+(25-23)^2 ) ) } \)
\( RMSE≈2.3 \)
The RMSE value indicates my model performs relatively well on the given problem. Of course, this is just an example, and in practice, I would try to tune the model to get a better result, but for demonstration, the result is good enough.
The easiest way to calculate RMSE using Python is to import the mean_squared_error() function from the Scikit-Learn library and use it to calculate MSE. I can then calculate the root of the MSE value using the sqrt() function from the NumPy library to get the RMSE value.
- Python Data Processing: What is NumPy
- Python Data Processing: How to Use NumPy for Math and Statistics
Let's start by importing what we will use:
# Import the libraries we need
from sklearn.metrics import mean_squared_error
import numpy as np
Next, I’ll create some example data. Again, I will create two lists: one representing actual values and another representing model predictions.
# Create the list of actual values
# and the list of predicted values
actual_values = [500, 600, 213, 370, 510, 220, 490, 700]
model_predictions = [500, 600, 203, 362, 500, 225, 430, 690]
Finally, I can calculate MSE using the mean_squared_error() function imported from Scikit-Learn, and then calculate its root using NumPy to get RMSE.
# Calculate RMSE
rmse = np.sqrt(mean_squared_error(actual_values, model_predictions))
The resulting RMSE is roughly 22.33, which is a relatively good value considering the magnitude of the actual values.
How to Calculate the Mean Absolute Error
The Mean Absolute Error, or MAE, is commonly used to evaluate regression models. It calculates the average absolute difference between the actual values and the predicted values:
\( MAE= \frac{1}{m} \sum_{i=1}^{m}|y-\hat{y_i}| \)
In the equation above:
- MAE - Mean Absolute Error
- yi - actual value
- ŷi - predicted value
- m - number of samples
There are two main advantages to using MAE over RMSE:
- Robustness to outliers - because of how MAE is calculated, it is less sensitive to data outliers.
- Interpretability - since MAE represents the average difference between our predicted and real values, it is even more interpretable than RMSE.
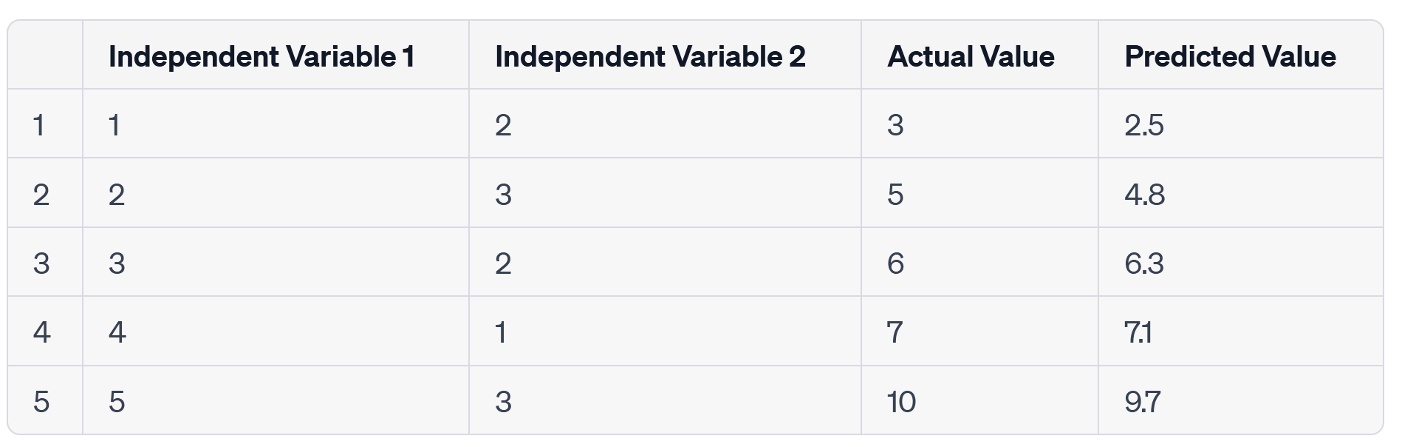
Let's demonstrate how to calculate MAE with the following example:
Using the equation for MAE mentioned earlier, the MAE would be:
\( MAE= \frac{1}{5}(|3-2.5| + |5-4.8| + |6-6.3| + |7-7.1| + |10-9.7|) \)
\( MAE=0.28 \)
The above result means that, on average, the predicted values are off by 0.28, which is a relatively good result if you consider the magnitude of the actual values.
To calculate MAE in Python, I can use the mean_absolute_error() function from the Scikit-Learn library.
# Import the libraries we need
from sklearn.metrics import mean_absolute_error
First, I’ll create some example data. Again, I will create two lists: one representing actual values and another representing model predictions.
# Create the list of actual values
# and the list of predicted values
actual_values = [500, 600, 213, 370, 510, 220, 490, 700]
model_predictions = [500, 600, 203, 362, 500, 225, 430, 690]
Finally, I can calculate MAE using the mean_absolute_error() function from the Scikit-Learn library.
# Calculate MAE
mae = mean_absolute_error(actual_values, model_predictions)
The result we get is an MAE of 12.875, which is relatively good considering the magnitude of the actual values.
In conclusion, the efficacy of regression models is significantly influenced by the performance measures chosen for evaluation. In this article, you learned about the R-Squared (R2) score, Mean Squared Error (MSE), Root Mean Squared Error (RMSE), and Mean Absolute Error (MAE). I showed you how the R-squared score can sometimes paint an overly optimistic picture, even though it offers an overview of the explained variance. MSE and RMSE, on the other hand, provide a more nuanced understanding of the model's performance, while MAE offers a clear, easily interpretable assessment of your model's errors. Understanding these metrics and their interplay will help you develop and refine powerful, accurate, and robust regression models. As long as you consider the specifics of your problem and the nature of your data when choosing a performance evaluation metric, I’m confident you won't run into any problems trying to predict how your model performs on unseen data.

