


Table of Contents
A guideline on how to use pivot tables in Pandas to summarize and organize data stored in large datasets was the focus of our previous article. To build up, this article will now cover the groupby method. This method is a crucial tool in data analysis, similar to pivot tables. The groupby method enables us to divide data into groups and perform various operations on that divided data.
Combining the two guides, you will have all of the tools necessary to manipulate data stored inside Pandas DataFrames to prepare it for analysis.
Article continues below
Want to learn more? Check out some of our courses:
What is the Groupby Method
Similar to pivot tables, the groupby method is an essential tool in data manipulation and data analysis. This is especially true when we have to deal with large datasets. However, there is a significant difference between the two. On one hand, pivot tables focus more on reorganizing data, similar to their counterparts in spreadsheet software like Excel. On the other hand, the groupby method is highly similar to the GROUP BY clause in SQL. Therefore, those familiar with SQL should feel at home using it.
There is a main similarity between the groupby method in Pandas and the GROUP BY clause in SQL. This resemblance lies in their ability to segment data into groups based on one or more columns and then perform aggregate operations on each group. This makes both tools highly effective for data analysis, especially when dealing with large datasets.
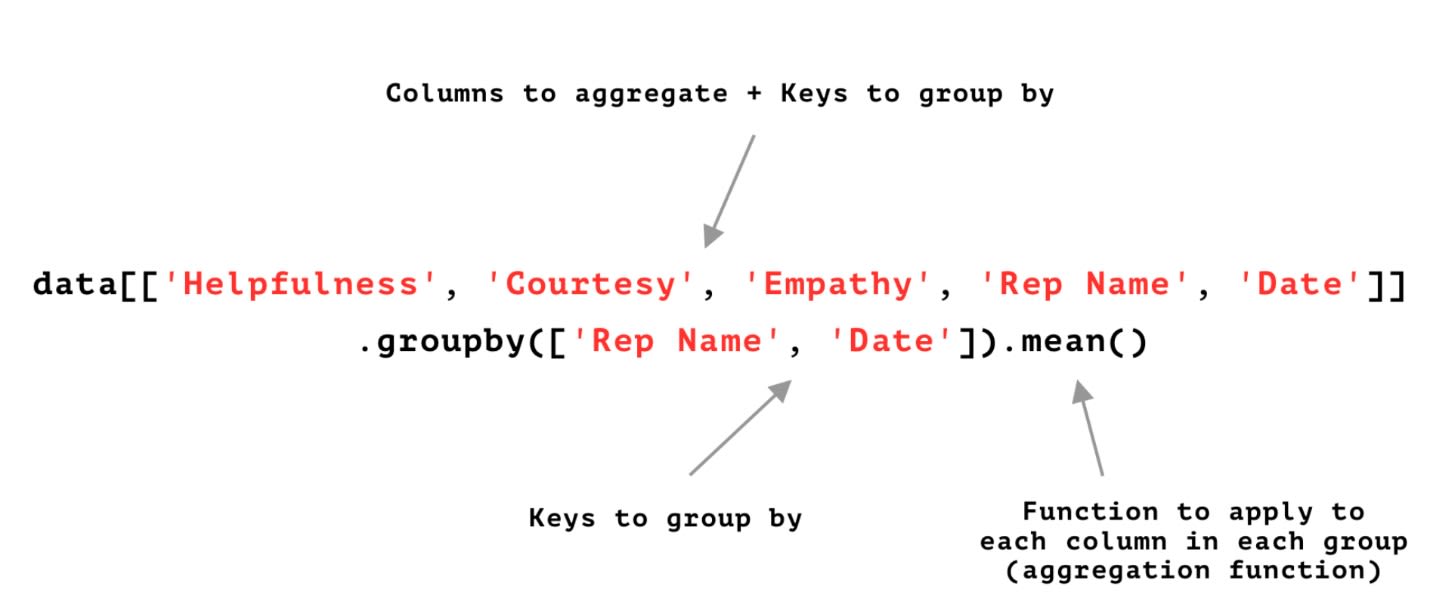
When using the groupby method in Pandas we need to define the following:
• which columns to aggregate
• which keys to use for grouping data
• the aggregation function
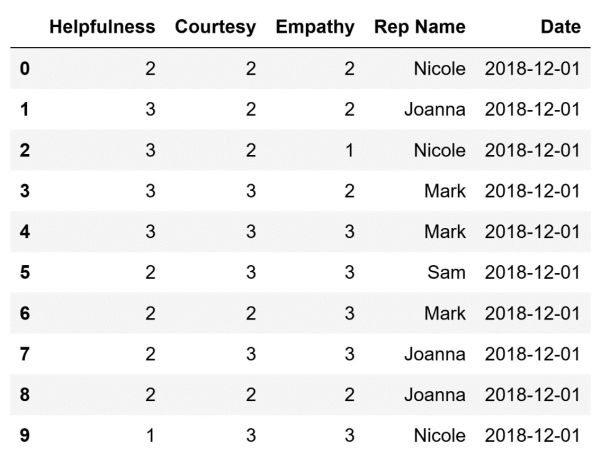
Let's demonstrate this in an example. For starters, I am going to create a DataFrame to be used as an example:
import pandas as pd

# Create some example data
data = {
    'Helpfulness': [2, 3, 3, 3, 3, 2, 2, 2, 2, 1],
    'Courtesy': [2, 2, 2, 3, 3, 3, 2, 3, 2, 3],
    'Empathy': [2, 2, 1, 2, 3, 3, 3, 3, 2, 3],
    'Rep Name': ['Nicole', 'Joanna', 'Nicole', 'Mark', 'Mark', 'Sam', 'Mark', 'Joanna', 'Joanna', 'Nicole'],
    'Date': pd.to_datetime(['2018-12-01'] * 10)  # Convert to datetime when creating the data
}

# Create a DataFrame from the example data
df = pd.DataFrame(data)
The code above will create the following DataFrame and store it in the df variable:
The DataFrame above contains data that represents how a certain sales representative was graded by a customer on a particular date. One representative can appear multiple times. This is because each one of them interacts with multiple customers daily.
- Intro to Programming: Why Beginners Should Start With Python
- Intro to Programming: What Are Different Data Types in Programming?
How to Aggregate Data Using the Groupby Method
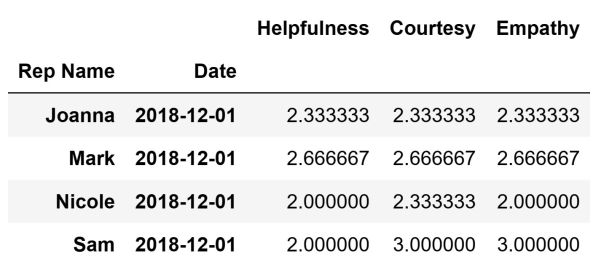
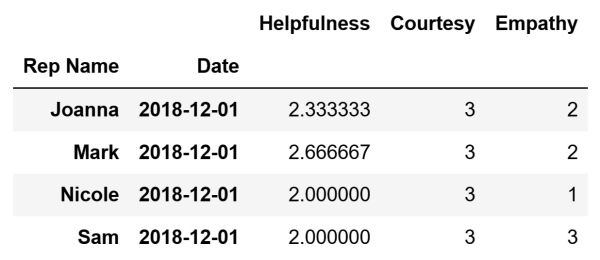
To summarize data using the groupby method we need to define which columns we want to aggregate and which keys we want to use to aggregate the data. Moreover, we need to decide what aggregation function we want to use. For example, we can determine the average ratings for Helpfulness, Courtesy, and Empathy that each sales representative received on a specific date. The results give insights into the performance of these sales representatives in these key areas.
# Calculate the average values of the three metrics
# for each sales representative and store them in a DataFrame
columns_to_aggregate = [
    'Helpfulness',
    'Courtesy',
    'Empathy',
    'Rep Name',
    'Date']
keys_to_use = ['Rep Name', 'Date']
average_values = df[columns_to_aggregate].groupby(keys_to_use). agg('mean')
The code above will create the following DataFrame that contains the calculated average values and store it inside the average_values variable:
In the background, a two-step process happens. For starters, we take our raw data and group it based on the defined keys into groups. Afterward, the aggregation function we defined gets used on each group. After applying the aggregation function to every group, the results are combined into a DataFrame using Panda. Lastly, the final result is provided by retrieving this combined DataFrame.
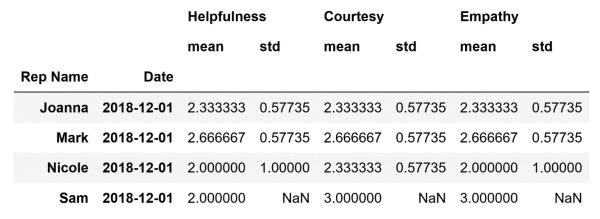
We can apply multiple aggregation functions to our data, similar to how we can use multiple columns and multiple keys to group our data. Therefore, instead of calculating just the average values, we can calculate both the average values of the three metrics and the standard deviation:
# Calculate the average values and the standard deviation
# of the three metrics for each sales representative
# and store them in a DataFrame
columns_to_aggregate = [
    'Helpfulness',
    'Courtesy',
    'Empathy',
    'Rep Name',
    'Date']
keys_to_use = ['Rep Name', 'Date']
values = df[columns_to_aggregate].groupby(keys_to_use).agg(['mean', 'std']
The code above will create the following DataFrame that contains the calculated average values and store it inside the values variable:
As can be seen, the DataFrame above contains both the average values and the standard deviation of Helpfulness, Courtesy, and Empathy. They stand for each sales representative on the 1st of December, 2018. It is obvious that for Sam we are not able to calculate the standard deviation. Therefore we have NaN values in the DataFrame. This is a byproduct of us having only one row that represents information about Sam in our original DataFrame. In other words, the values in that row will also be the average values for the three metrics. However, there is no way to calculate the standard deviation because we only have one value for each metric
Finally, there is a big advantage of using the groupby method over similar methods that also summarize data, such as the pivot_table method. Such an advantage is that it allows us to apply a different aggregation function to different values using a dictionary of aggregation functions:
# Creating a dictionary to specify different aggregation functions for each metric
agg_funcs = {
    'Helpfulness': 'mean',  # Mean for Helpfulness
    'Courtesy': 'max',      # Max for Courtesy
    'Empathy': 'min'        # Min for Empathy
}

# Define which columns to aggregate
columns_to_aggregate = [
    'Helpfulness',
    'Courtesy',
    'Empathy',
    'Rep Name',
    'Date']

# Creating which keys to use when aggregating data
keys_to_use = ['Rep Name', 'Date']

# Aggregate data
grouped_values = df[columns_to_aggregate].groupby(keys_to_use).agg(agg_funcs)
The code above will create the following DataFrame and store it inside the grouped_values variable:
Keep in mind that when you define which aggregation function to use for which metric using a dictionary, the resultant DataFrame will not display that. Even though the Helpfulness column contains the mean values of Helpfulness, a reference to that will not be included in the column name.
- Intro to Pandas: What is a Pandas DataFrame and How to Create One
- Pandas vs Excel: Which Is the Best for Data Analysis?
How to Recreate Pivot Tables Using the Groupby Method
In most cases, pivot tables are more readable than the results we get using the groupby method. This is a byproduct of the pivot_table method being able to create an output that resembles Excel pivot tables. In addition, this output can have hierarchical indexes and columns based on how we define the index, columns, and values parameters of the method. On the other hand, the groupby method can produce a multi-level index based on the defined grouped keys. However, the results are usually less readable. The reason is the lack of the standard pivot table format that can display multiple levels of grouping and aggregation in a user-friendly way.
However, the groupby method is more flexible for complex data manipulation tasks. Therefore, it is the method of choice when it is not necessarily important to create multidimensional summaries. Another case could be when we are more interested in being as precise as possible when manipulating grouped data.
To compare, let's demonstrate how we can create a pivot table using the pivot_table method. Afterward, how we can recreate that table (to a certain extent) using the groupby method?
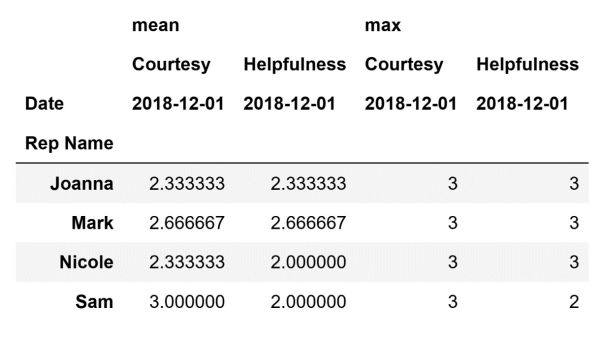
For starters, let's create a pivot table that provides a summary of Helpfulness and Courtesy ratings for each sales representative on our particular date:
# Create a pivot table
ratings_pivot_table = df.pivot_table(
    index='Rep Name',
    columns=['Date'],
    values=['Helpfulness', 'Courtesy'],
    aggfunc=['mean', 'max']
)
The code above will create the following DataFrame and store it inside the ratings_pivot_table variable:
We can recreate this same DataFrame, to a certain extent, using the groupby method. The structure of it will not be identical to the structure of the pivot table above. However, it will contain the same information. To do so, we can define our groupby method like this:
# Recreate the pivot table
columns_to_aggregate = ['Rep Name', 'Date']
keys_to_use = ['Helpfulness', 'Courtesy']
grouped_ratings  = df.groupby(columns_to_aggregate)[keys_to_use].agg(['mean', 'max'])
The code above will create the following DataFrame and store it inside the grouped_ratings variable:
The resultant DataFrame contains the same information that the pivot table contains. However, it is not presented the same i.e. it is not as visually pleasing and easy to analyze. Nevertheless, as mentioned before, creating user-friendly multidimensional summaries is not the strong point of the groupby method.
To conclude, the groupby method provides a convenient way of grouping data and applying various functions to it. Using it we can not only apply one function on our data when we are aggregating it, but also multiple functions. Consequently, we can manipulate data with great precision. Overall, the groupby method is a highly valuable tool. Thus, each person working in the field of data analysis should be familiar with it.

